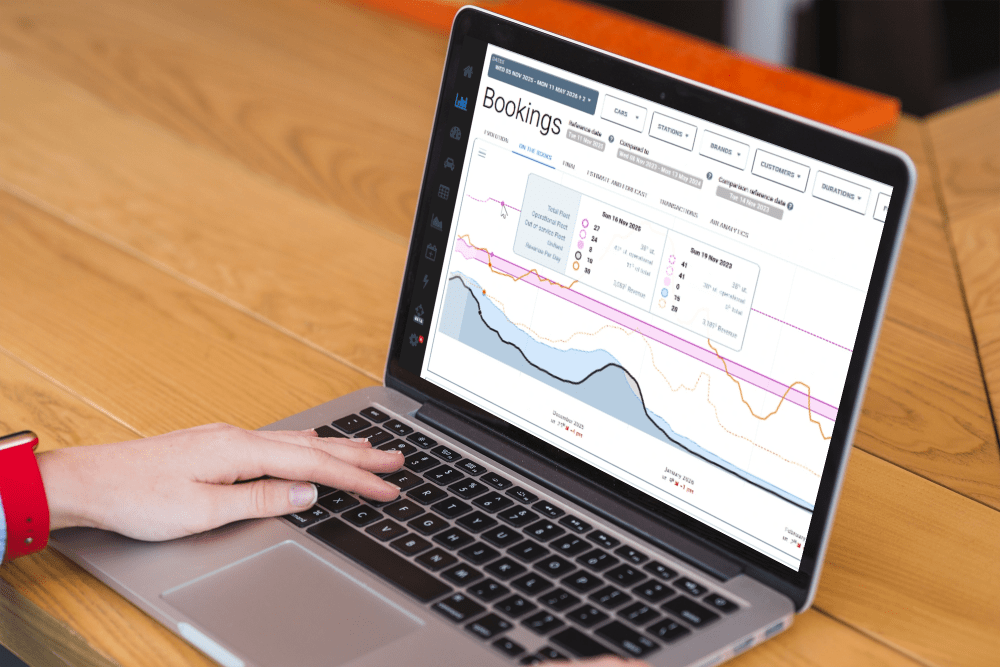

Make the Most of Your Non-Available Fleet Data
In your WeYield Apps, you can already visualize the difference between your total fleet and your available (operational) fleet.
This distinction is key to truly understanding your performance — and many users still overlook how powerful it can be.
Why It’s Worth Using
1. Measure your unavailability rate precisely.
The non-available fleet includes cars under maintenance, damaged, in transit, or being prepared.
Keeping this rate below 5% is the international best practice among WeYield revenue managers.
2. Optimize your profitability.
Your total fleet defines your full revenue potential.
Knowing when out-of-service cars will return helps you plan better and continue accepting reservations with confidence.
3. Strengthen your operations.
Tracking every car’s status improves coordination between operations and revenue management, reducing downtime and non-productive moves.
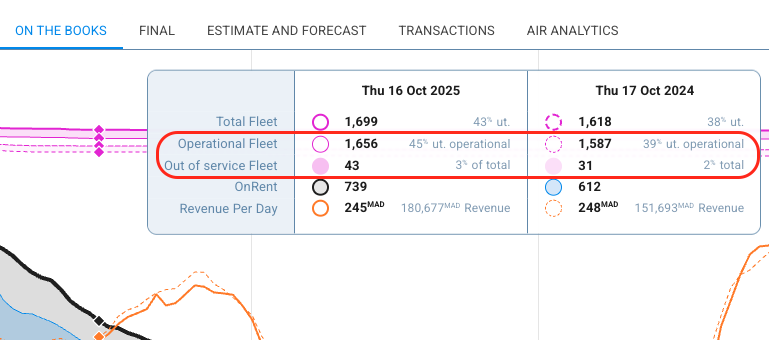
How to Read It in Your Dashboards
In your fleet graphs, you’ll find pink lines showing the distinction between total and available fleets:
- Solid pink line (dark): Total fleet
- Solid pink line (light): Current operational (available) fleet
- Dotted pink line (light): Last year’s operational fleet
The pink shaded area between lines shows the share of your fleet that’s out of service: helping you compare trends year over year at the same reference date.
Setting Your Utilization Rate
In your Settings, you can select how the utilization rate is computed by default in modules where both indicators are not available at the same time.
Note: The setting is global for the team, not individual per user.

Systems Supporting This Function
The available vs. total fleet distinction is supported for clients using:
Wheelsys • Rent Centric • RentalCar Manager • Renteon • Sixt data (via Google Looker)
➡️ Soon also available for Rentway (Emotion) and MyRentCar (Hitech) users.
Pro Tip
Monitor your non-available share each month.
If it consistently exceeds 5%, it might be time to review maintenance planning or vehicle turnaround processes, small operational wins can unlock big revenue gains.