Release notes
Discover what's new in WeYield Apps!

June 1, 2026
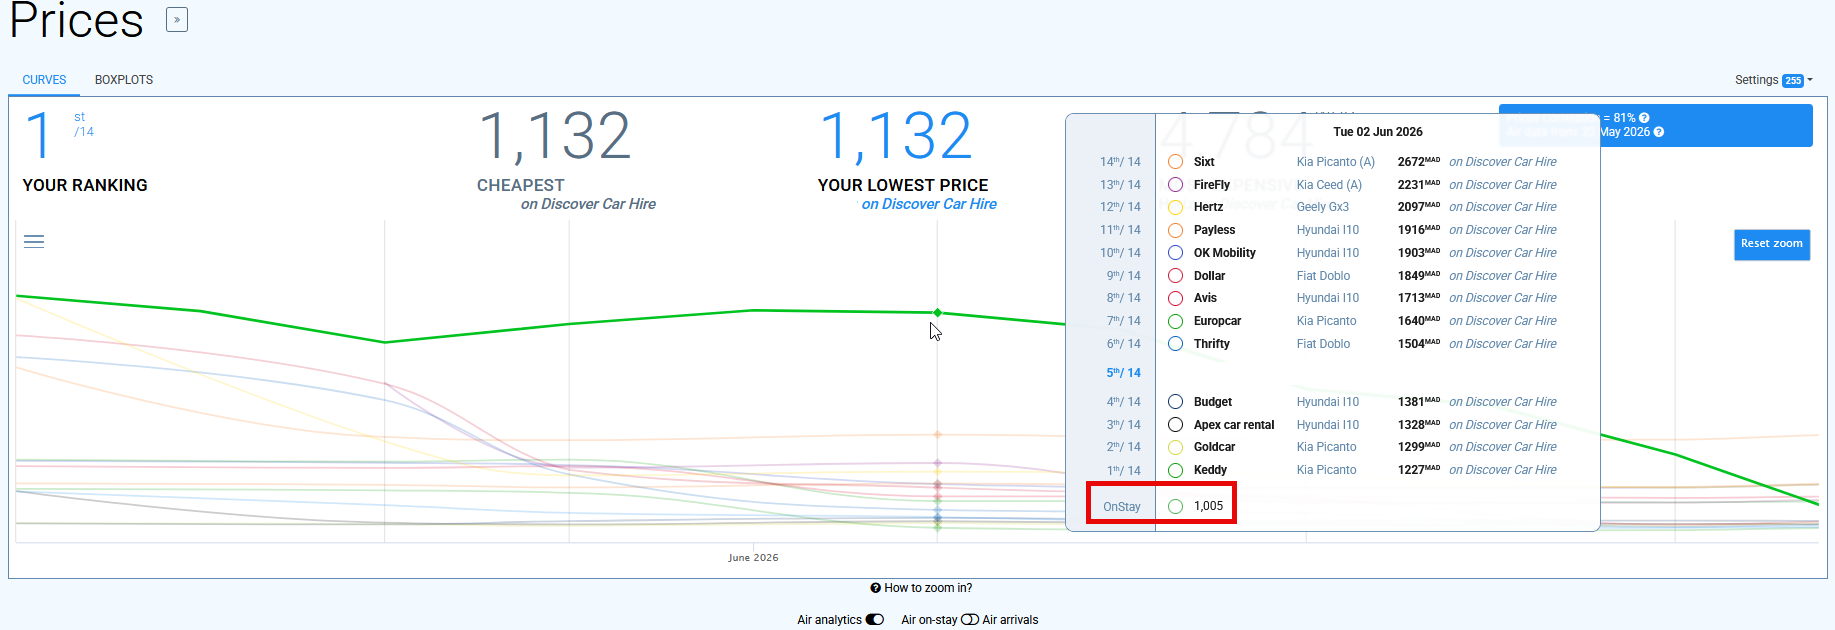
Air Analytics into Prices
Airline Bookings data is now integrated directly into your Prices module. You can see travel seasonality on top of your pricing patterns in one view, so you immediately know whether your rates align with actual traveler demand and not just historical pricing habits.
When comparing surveys, you can also monitor the evolution of air bookings across a wide date range at a glance.
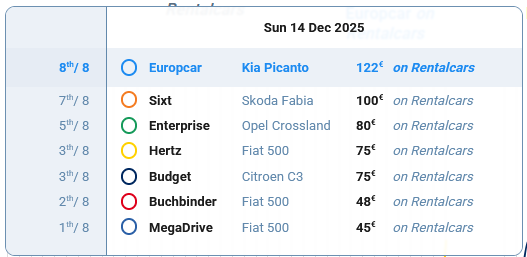
Survey Comparison
When using the Survey Comparison feature, air data is displayed as follows.
The solid green line shows the air data associated with your main survey. The dotted green line shows the air data associated with the comparison survey date. The tooltip displays the difference between the two, consistent with the price comparison display.
A blue overlay appears in the top right corner of the graph, as in the Bookings Air Analytics view. It serves two purposes: it displays the reference date of the air data, which is a frequent question from clients, and it shows the correlation between your pricing curve and the Air OnStay curve.
How to activate it
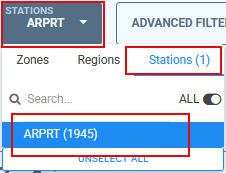
Air Analytics in the Prices module is not activated by default. The first step is to select a geography that contains a station with a configured IATA code.
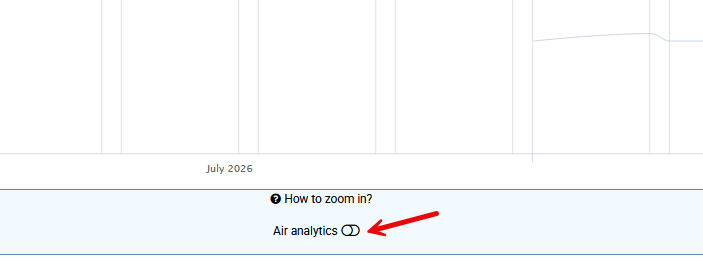
Once a relevant geography is selected, a toggle appears below the graph. Switch it on to display the air data corresponding to your current survey period.
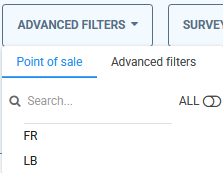
The 4 filters that affect Air Analytics data
Current survey determines the reference date for the air data displayed.
Survey duration determines the length of stay of the air bookings selected. At this stage, the full on-stay and arrivals view is not available. The data is always filtered by the selected duration.
Stations determines the geography. Only stations with a configured IATA code will return air data.
Point of Sale is a new filter introduced with this release. It lets you filter air data by traveler origin, giving you visibility into where your passengers are actually coming from. When no filter is selected, the worldwide traffic is used by default, not the sum of available origins in the survey.
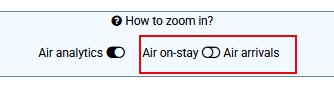
OnStay vs Arrivals
To switch between OnStay and Arrivals view, use the same toggle as in the Bookings module under the Air Analytics tab. The behavior is identical across both modules.
February 25, 2026
RateShop Module – New Logic
The former “All Market” aggregated view has been removed.
Market creation is now mandatory to:
- Properly filter and organize competitors
- Track competitors within clearly defined markets
- Enable more coherent and actionable analysis
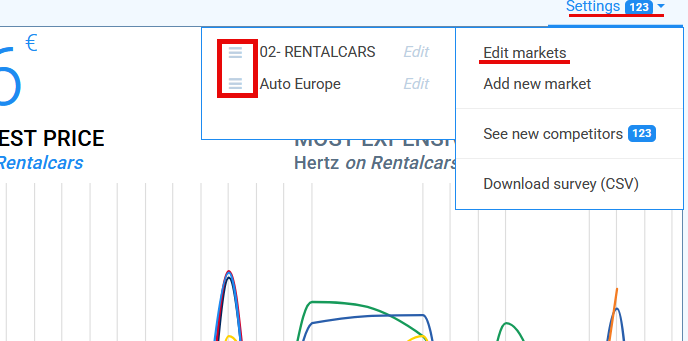
- Be sure to order your markets, so your default one is the highest on the list!
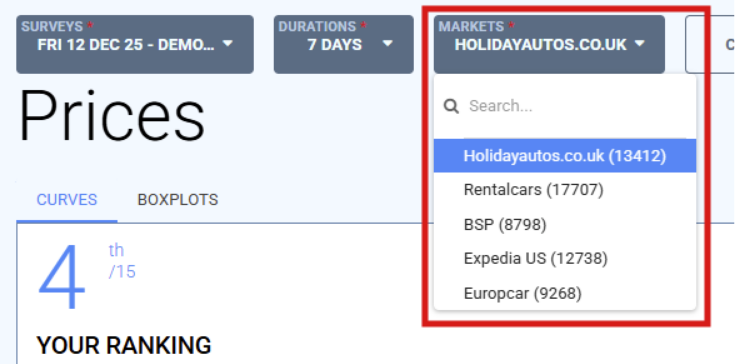
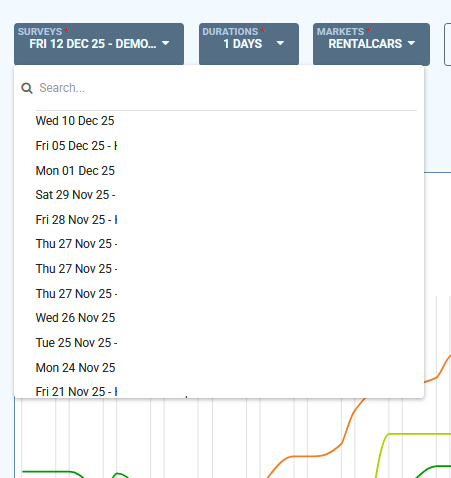
Markets and Surveys Moved to Filters
We reworked the page layout to gain space and improve usability:
- Markets and Surveys are now part of the global Prices filters
- Selections are grouped where they logically belong for faster analysis
- The most important filters now also dynamically display the amount of price points that are available for each selectable filter in conjunction with those already selected
Markets filter
Surveys filter
New Tooltip Design in RateShop
Spot gaps and trends faster with:
- New tooltip icons
- Cleaner visual hierarchy
- Easier comparison across competitors and dates
Tooltip Menu (like the Booking Menu)
Based on what has been released on Booking menu, now every tooltip now includes a menu (top-left corner) with enhanced controls:

- Lock tooltip position – Fix the tooltip anywhere on the page by dragging it with your mouse. (When enabled, the following two options are disabled.)
- Adjust cursor distance – Set how far the tooltip should appear from your cursor.
- Chart boundary control – Decide whether the tooltip stays inside the chart area or can extend beyond it.
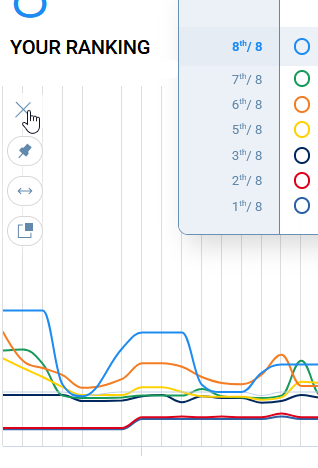
Improved Competitor Display
You can now temporarily hide competitors within a market:
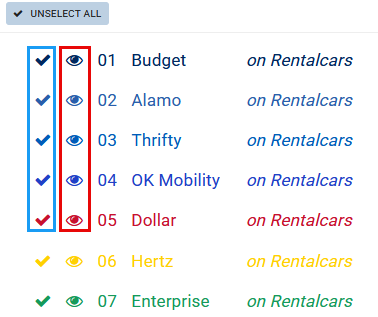
- Checkbox - Show or hide a competitor in graphs and tooltip.
- Eye icon - Hide a competitor curve from graphs only, useful for removing outliers or near stop-sell curves that flatten the analysis
February 18, 2026
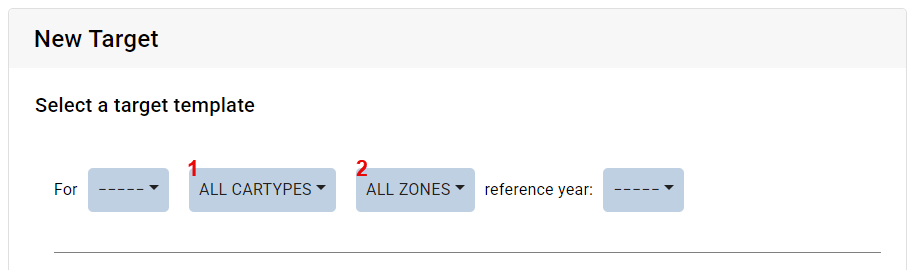
Target Module - Multi-Selection for Car types & Zones
You can now configure targets across multiple car types (1) and multiple zones (2) simultaneously. This allows for a more fluid strategy that reflects how your fleet actually moves.
Target Data update - Speed up with new "Fill" buttons
Instantly populate the current month with previous month's data, and pull real historical data from the current year to make reforecasting precise and effortless.

And you have the flexibility to select only the indicators you wish to update.

We have also added the possibility to archive the previous years target, in order to tidy up your target dashboard and speed up the display. They remain available and can be unarchived at any time.
February 10, 2026
Customizable Max Durations
You are no longer capped at 30 days. Team managers can now extend the maximum rental duration up to 60 days.
By adjusting this threshold, rentals up to 60 days will now be processed and analyzed as Short-Term Rentals.
Where to find this setup: Settings > Parameters
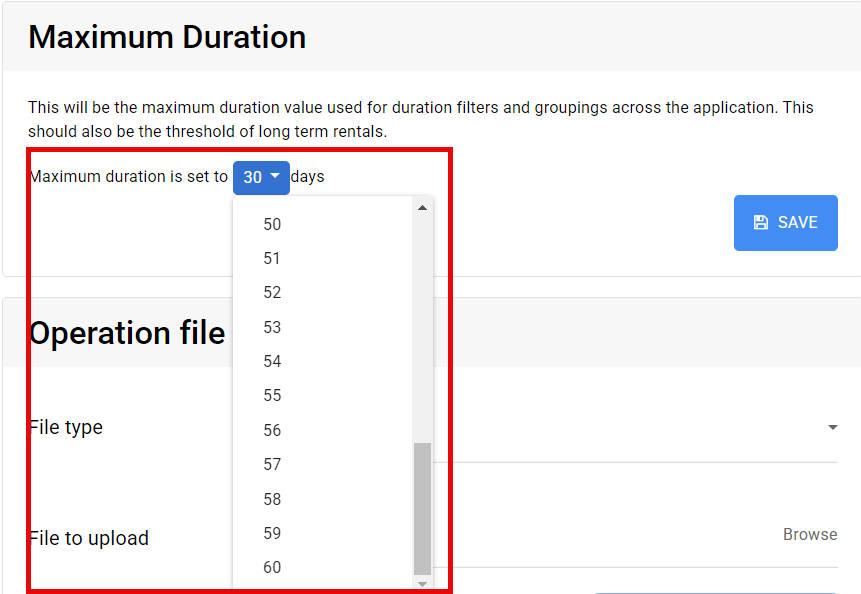
Once your maximum duration is updated, you will also be able to edit your duration groups to include the new available durations.
December 22, 2025
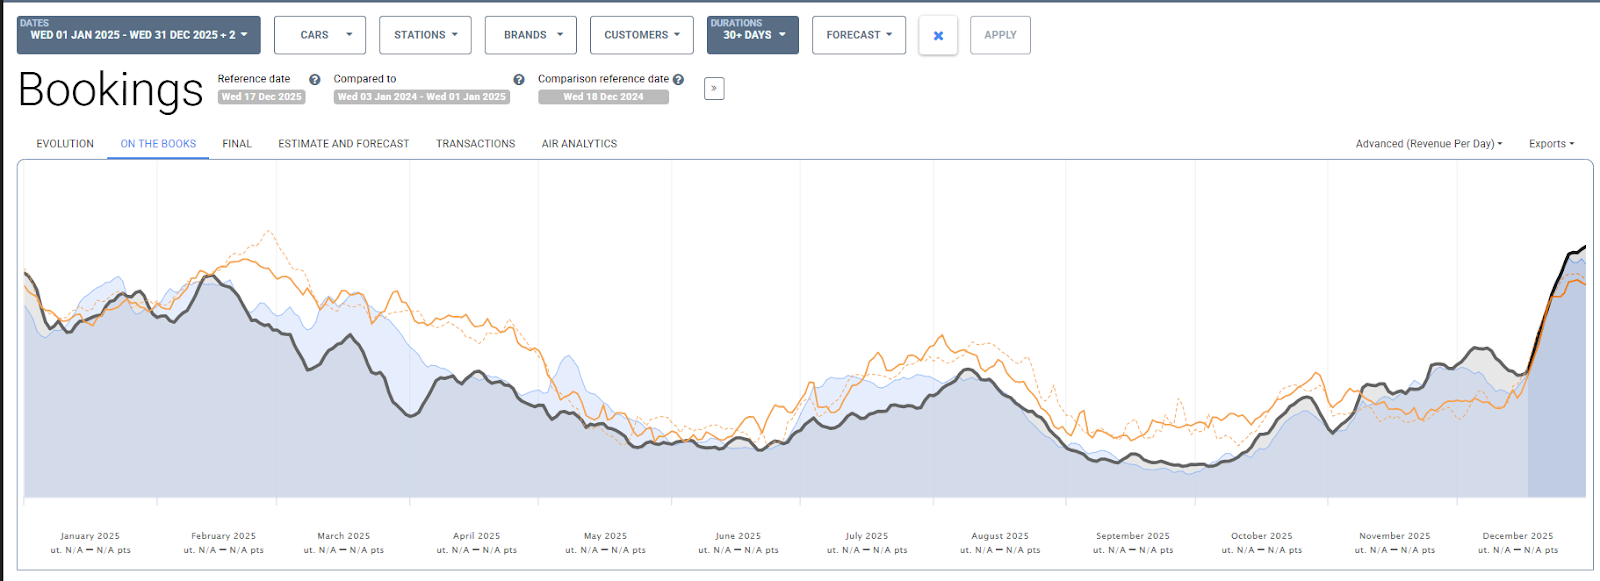
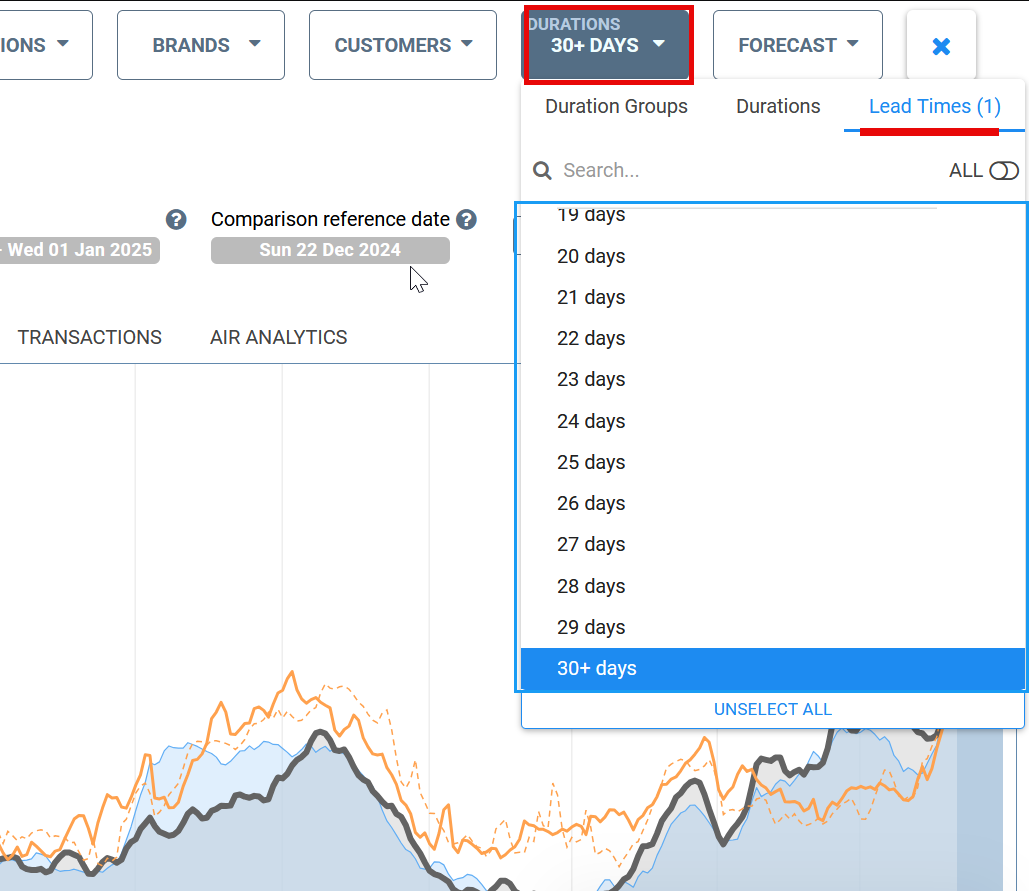
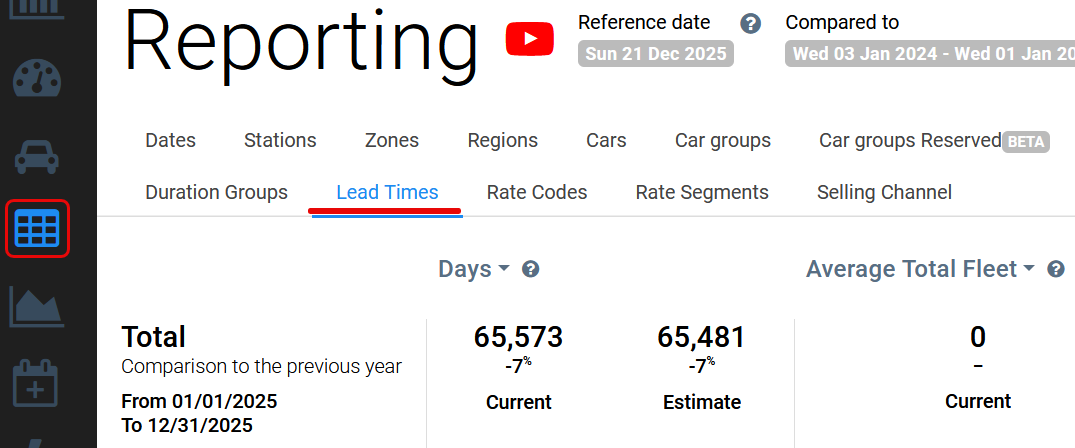
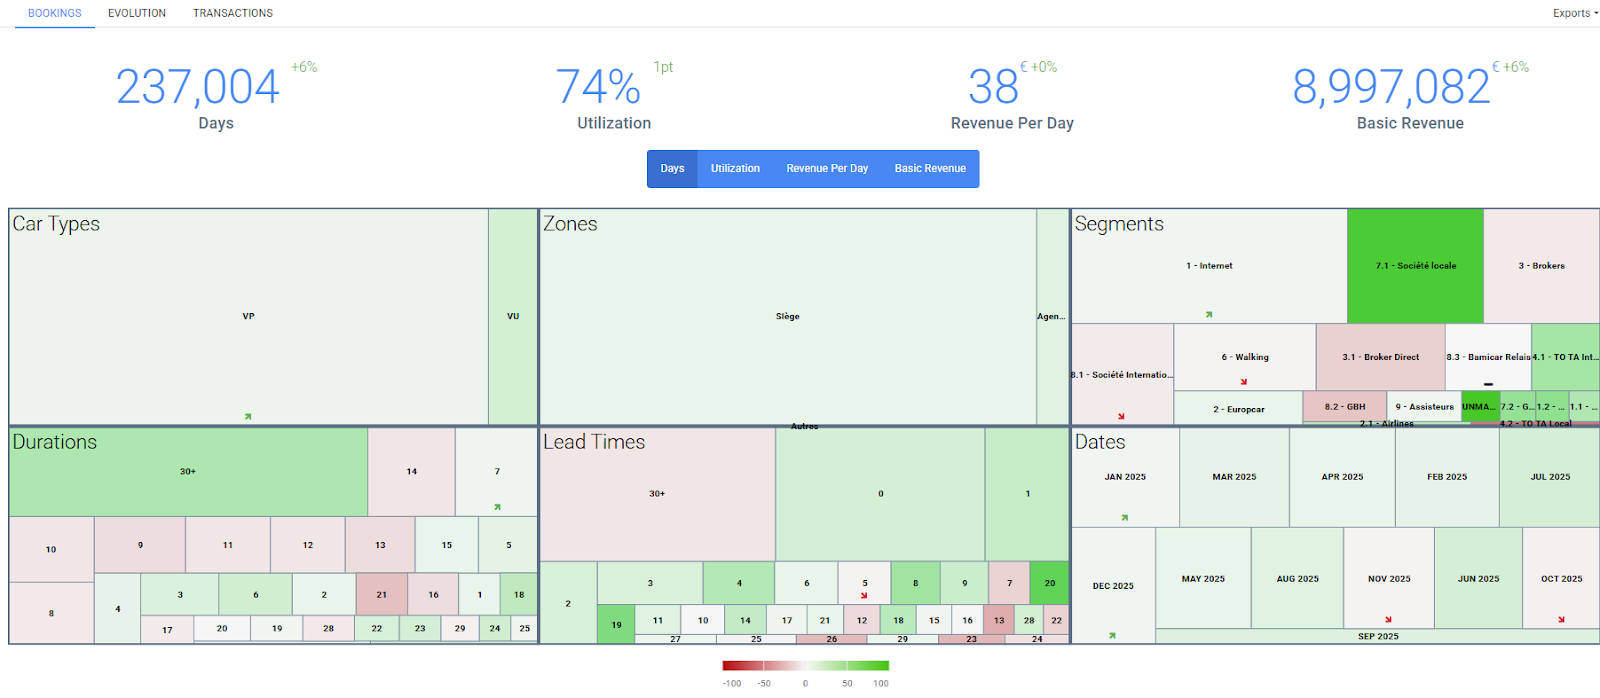
New filter, reporting tab, and treemap dimension on lead time
A new dimension filtering has been added to the WeYield Apps: lead time. You can now filter transactions by the amount of days separating the reservation date and the checkout date, and analyse very simply the pattern of activity generated by those reservations.
For example with 30+ days lead time
How to access to this filter?
This new KPI is also available as a Tab in the Reporting module:

And as a category of Treemaps:
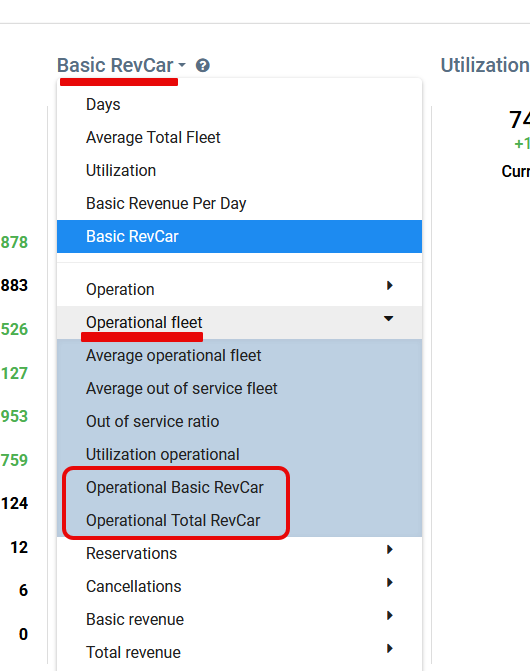
New reporting KPIs on operational RevCar
Following the general implementation of the computations of operational fleet in addition to the total fleet in the different Operations modules, we have added two new indicators to the reporting:
- Operational Basic RevCar
- Operational Total RevCar
Major update of the target module
In order to prepare 2026 more effectively, we added core functionalities to the modules settings:
- possibility to set targets by zones or car types (with a free selection of items for both values)
- Added the option to pre-fill values with either actual figures (for past months) or estimates (for future months)
- Added the option to copy values from the previous month to make it even easier to set a new target

November 12, 2025
New tooltip design and Menu
A clearer columns layout
Tooltips now display data in a column format, making comparisons more intuitive.
.png)
New Tooltip Display Examples
Date Range Comparison in Bookings.
The analyzed period and its comparison period are displayed side by side in two clear columns.
.png)
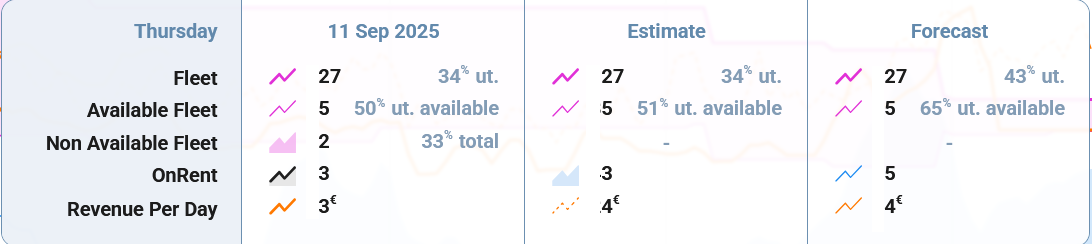
Estimated and Forecast Data in Bookings.
The analyzed date, estimated results, and forecasted results are each presented in separate columns, making comparisons straightforward.
New Tooltip Menu
Every tooltip now includes a menu (top-left corner) with enhanced controls:

- Lock tooltip position – Fix the tooltip anywhere on the page by dragging it with your mouse. (When enabled, the following two options are disabled.)
- Adjust cursor distance – Set how far the tooltip should appear from your cursor.
- Chart boundary control – Decide whether the tooltip stays inside the chart area or can extend beyond it.
New booking evolution selector
You can now select the interval range of days for your booking evolution close to the [evolution] button instead of selecting it below the graph as before.
What it changes for me?
Nothing really as it is more straight forward and more user friendly to have this selector close to the tab name.
Where to find it?
In three different main menues
- Evolution tab in the Booking menu
- Evolution tab in the Treemap menu useful to have all main business dimensions at a glance
- Evolution tab in the Updater menu useful to have all the principle source of information grouped on one page

January 20, 2025
New Search Analysis Feature
The Search Analysis feature provides a comprehensive tool for understanding user search patterns on your website anticipating demand trends for car rentals, and identifying missed opportunities. It tracks all the searches of potential customers even if they didn’t complete a booking. With seamless integration with Google Analytics, the feature enables you to analyze how users interact with your booking funnel, empowering data-driven decision-making for improved business outcomes.

Key Benefits of Using Search Analysis
1 - Insights: Gain visibility into what users are searching for on your website, enabling you to identify emerging trends (e.g., increased demand for specific dates or vehicle types) and make timely adjustments to pricing and inventory.
2 - Demand Forecasting: Analyze search trends, such as rental dates, to predict future demand and optimize pricing strategies.
3 - Marketing Impact Analysis: Track the effectiveness of your Traffic generation marketing campaigns by comparing the increase in searches and bookings during specific periods.
4 - Sales Impact Analysis: Track missed opportunities by analyzing non-converting traffic alongside operational filters (e.g., station, rental duration) to optimize your sales strategy.
Want to know more about this new feature? Read our blog article on How To Gain visibility into the future!
Fleet Plan Management
Making informed pricing decisions requires a clear understanding of your fleet's capacity. To help you stay on top of your future capacity, we’ve introduced a new module that allows for seamless management of fleet infleeting and defleeting, directly within the app. This ensures you always have access to the most up-to-date data on fleet availability.
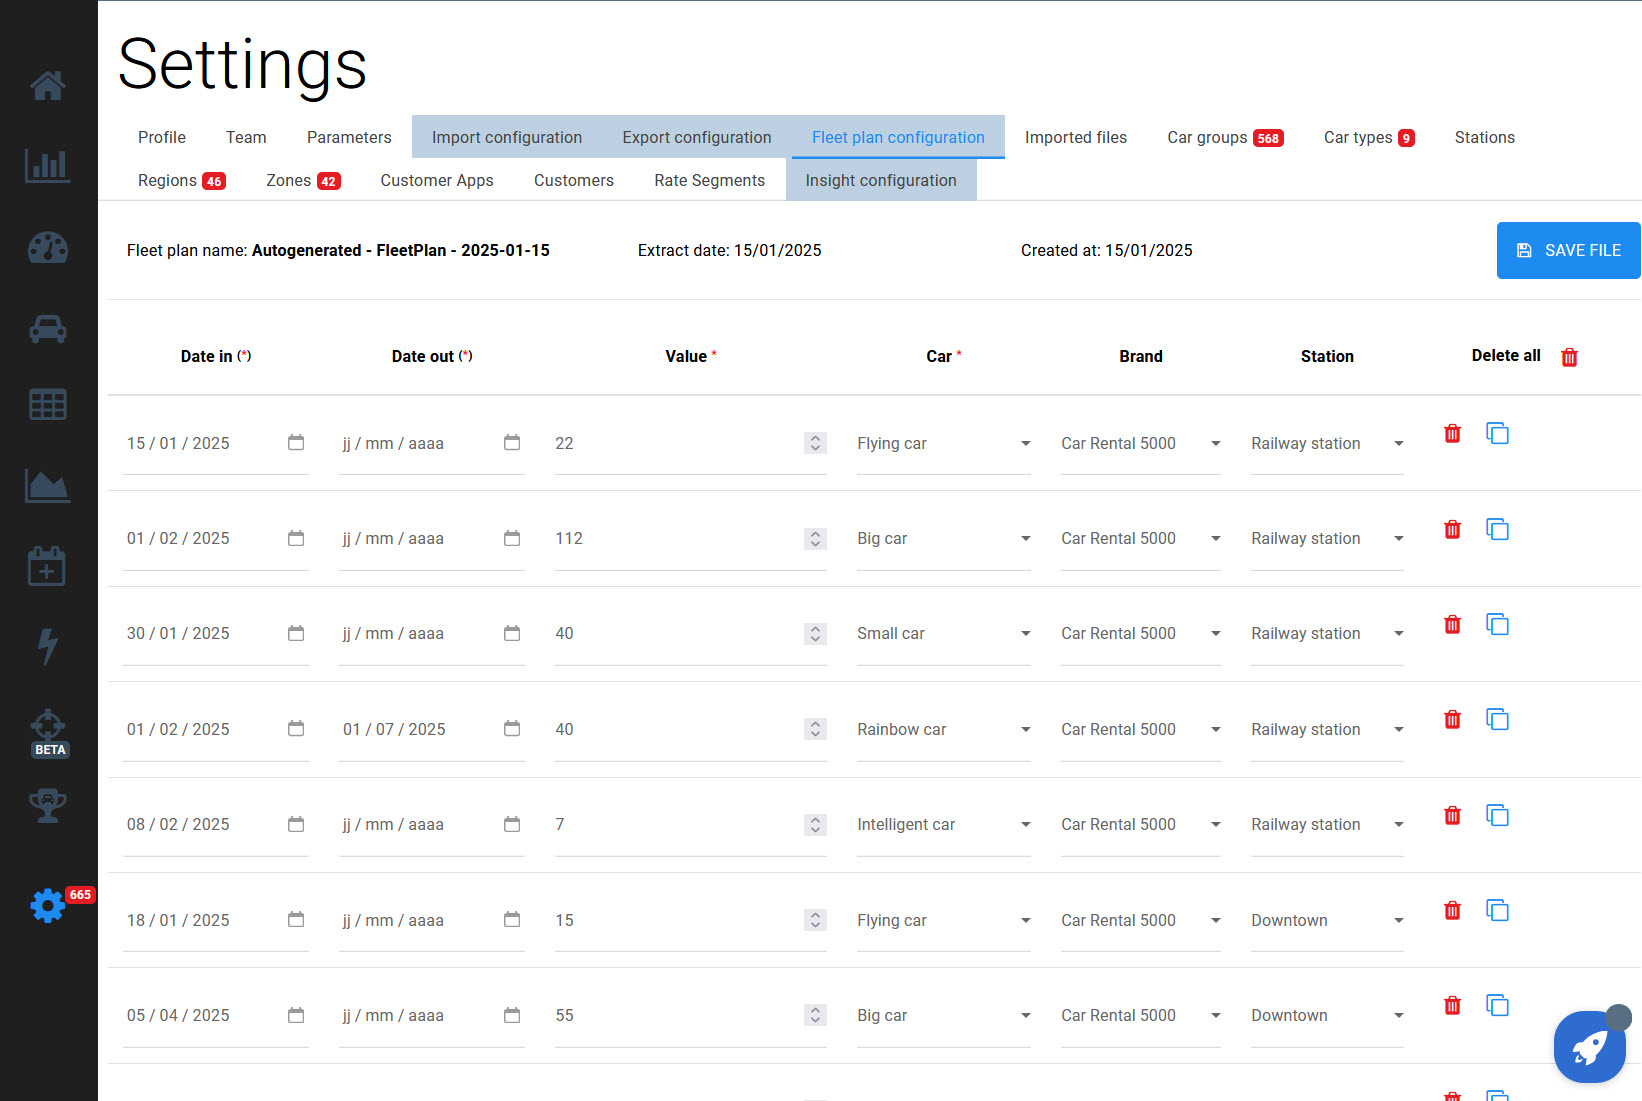
To enhance your fleet tracking with greater accuracy and precision, start optimizing your Fleet Plan today. This new feature is available upon request through your CSM. Book a meeting now!
Want to know how to update your fleet plan? Here the tutorial you need to improve your Fleet Management!
Rate Code Filtering
At WeYield we thrive to offer you with tools to better analyze and understand your business.
Our latest update introduces the ability to filter data by rate code across all operations modules. This enhancement allows you to gain deeper insights into the performance of each rate code, supporting more effective revenue optimization and ensuring greater revenue integrity.
With this feature, you can now refine your temporal analysis, ensuring that your decision-making is always guided by the most relevant, data-driven insights.
How to Filter by Rate Code:
1 - Click on the "Customer" drop-down menu
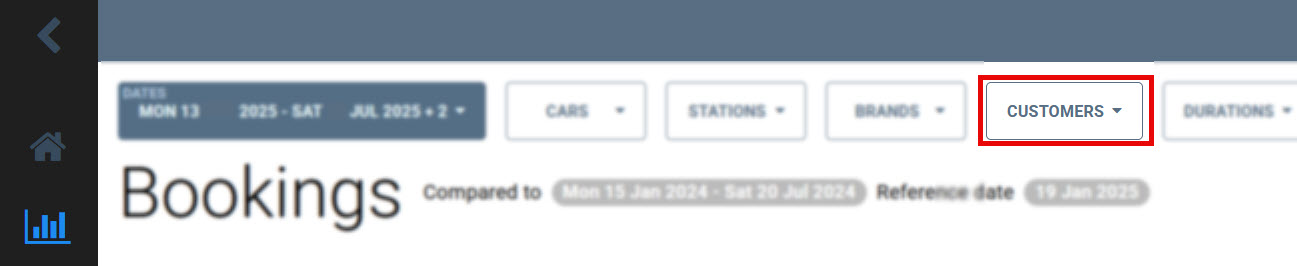
2 - Select the "Rate Codes" tab and choose the specific rate code(s) you wish to analyze.
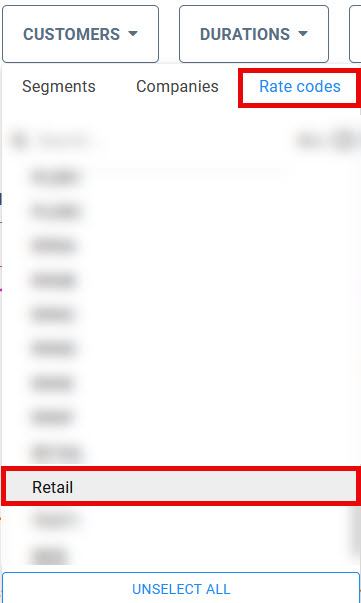
This new filtering capability is now available across all Operations Modules, including Booking, Treemaps, Updater, and Reporting.
November 20, 2024
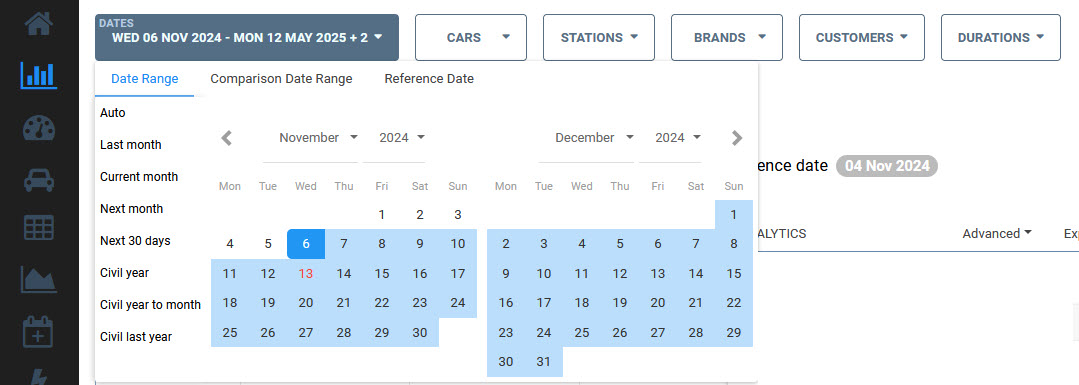
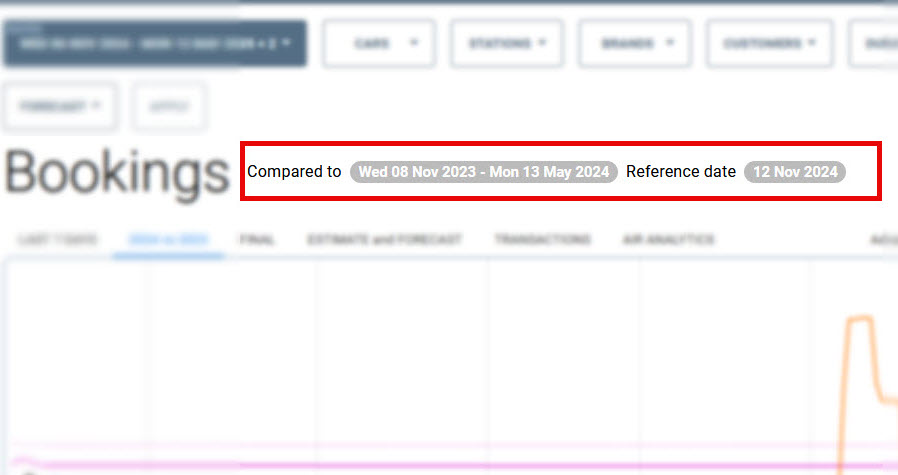
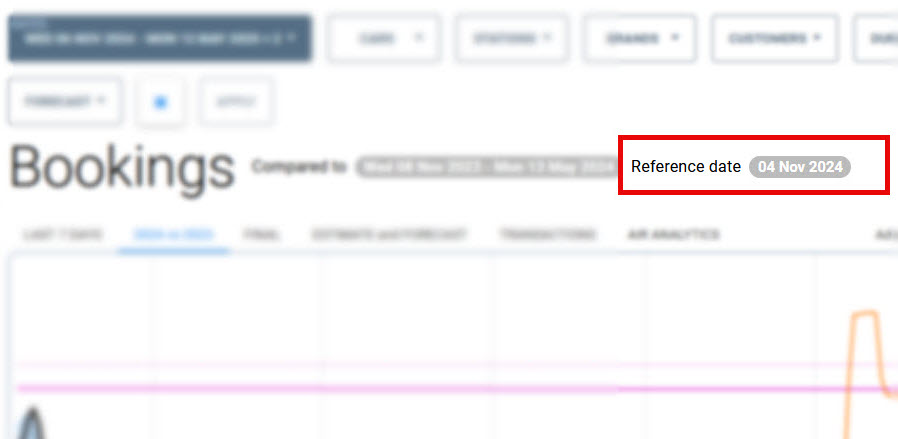
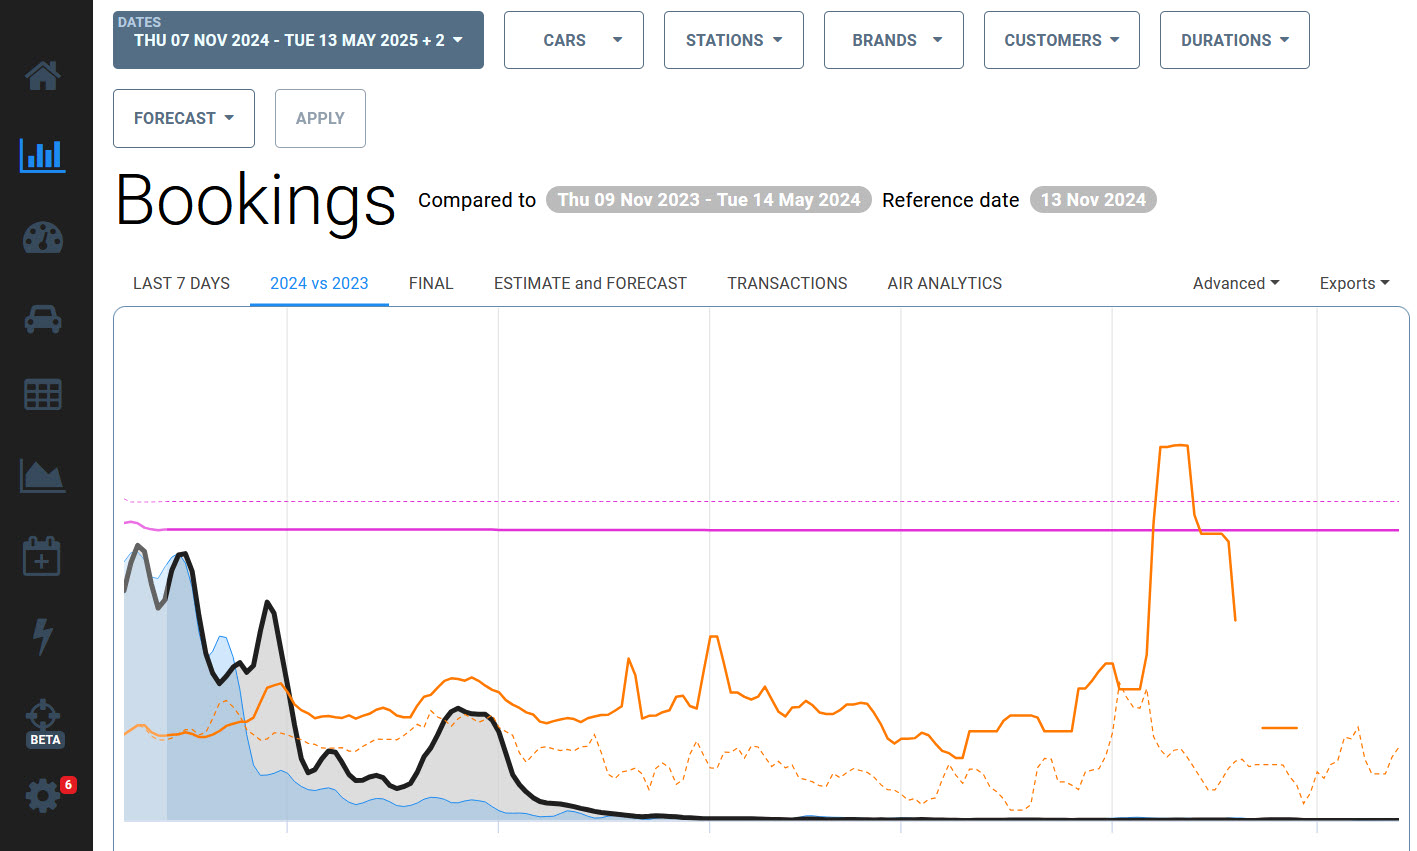
New Date Picker
This update helps our customer to improve their temporal analysis, ensuring decision-making is always informed by the most relevant insights.
Core Benefits
- Intuitive and Accessible Interface: Built for ease, the new date picker integrates seamlessly across relevant modules, making advanced analysis effortlessly accessible to all users.
- Dynamic Date Ranges and Comparisons: Move fluidly between timeframes and comparison types - whether analyzing year-over-year trends, pinpointing event-based insights, or monitoring seasonal shifts.
- Data-Centric Decision Support: By delivering data insights tailored to your operational rhythm, the date picker serves as a powerful tool to help you stay agile, strategic, and data-driven in a competitive environment.
Key Innovations
1. Centralized, User-Centric Design
We’ve set the date picker to a primary, accessible position across all modules. Now, you can focus on setting and adjusting date ranges with ease.

2. Enhanced Year-Over-Year and Event-Based Comparisons
Our new date picker goes beyond basic year-over-year analysis by incorporating an “Event Comparison” feature for time-sensitive scenarios. This allows for precise comparisons of movable events - like Easter or Ramadan - that fluctuate annually, aligning your analysis with real-world calendar shifts and delivering highly relevant context.
Example: In 2025, Easter falls on April 20, compared to March 31 in 2024. With this feature, you can set a custom comparison to align your metrics, ensuring your data reflects the true business impact of these periods.

3. Adaptive Reference Date Setting for In-Depth Analysis
In previous Apps version, the reference date was displayed on the left, as a navigation element, sticked to the main menu. To enhance usability, we’ve introduced the customizable reference dates in the Date Picker. This update allows you to analyze booking portfolios or any historical period from a different Reservation Date perspective. This added flexibility gives you greater control, enabling you to identify emerging trends, optimize inventory, and benchmark more effectively against past performance.

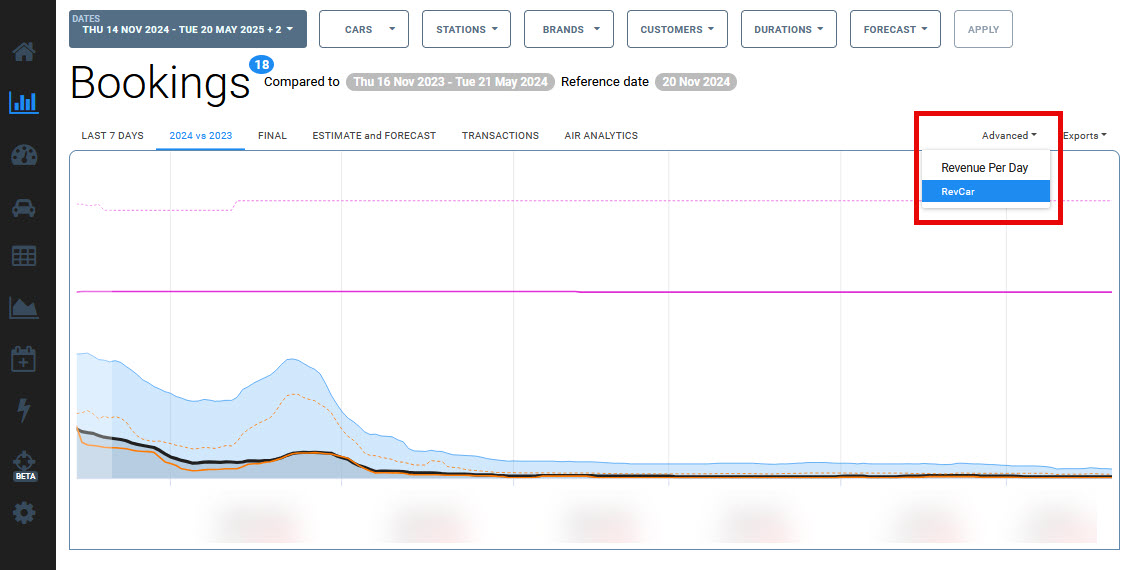
Bookings Page Design Update
We've revamped the design of the Bookings module, a core component of our Operations Suite. By simplifying the design, we've made it easier to navigate and use.
New dropdown menu added under the "Advanced" label, allowing you to select either RevCar or Revenue Per Day (RPD) as your KPI.
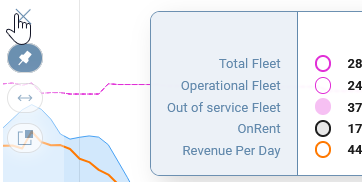
New Fleet Control View
The new and improved Fleet Control View has been designed to provide deeper insights into your fleet's performance. This table offers a comprehensive overview of critical performance metrics for each individual car type, car group, or region.
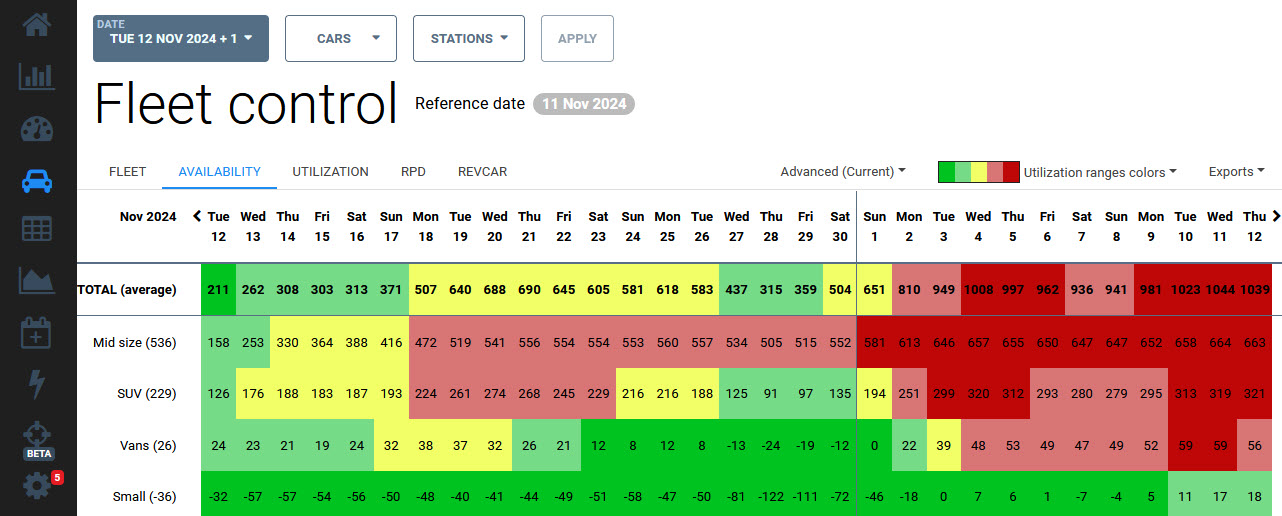
1. Extended date range
By extending the date range from 14 to 31 days, you can now identify potential maintenance issues or seasonal trends earlier, allowing for proactive planning and optimization. You can also more easily monitor your performances over a full month.
.

2. New Metrics displayed
Each indicator is presented at both the car type/group and total fleet levels. Understanding metrics like availability, utilization, RPD, and RevCar will help you optimize pricing strategies, improve fleet utilization, and increase revenue.
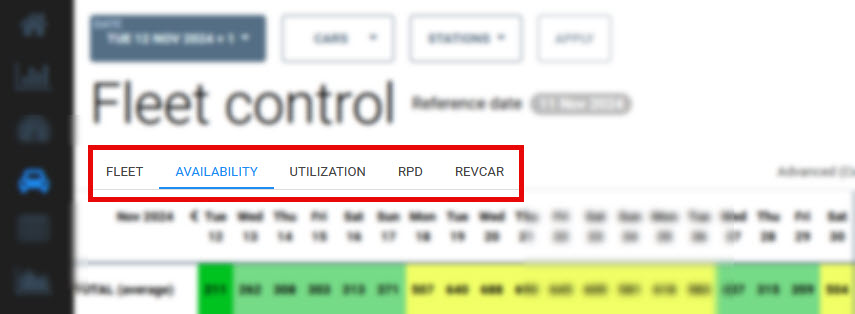
3. Current view and Estimate view
Our new dropdown menu lets you seamlessly switch between current and estimated values for all metrics. This allows you to easily switch between current and estimated values for all metrics, providing a more comprehensive view of performances. By enriching current data with the previous year’s trend, you can identify trends, potential issues, and opportunities for optimization.

4. New Color coding for better instant understanding
Our new color-coded system offers a more nuanced view of utilization levels. By using five distinct color brackets, we can easily identify specific performance ranges and make data-driven decisions to optimize fleet utilization.

Maximise your business performance with the best of technology and expert coaching
