
Customers using the WeYield rate shopping module can now quickly and easily explore the price evolution of pickup dates based on their rateshopping history with us. So we decided to review some of the interesting tasks this new report can help you investigate.
Here are some ideas for you to consider:
1. Identify your price evolution over time and relative position to the market as a whole, so you can rationalise if you made the correct pricing strategy.
Clients can use the new report to review how prices for key dates evolved over time and identify if their chosen strategy (top down, or bottom up or other price movements we have seen such as starting high, dropping low, then surging up high again, like a roller coaster) was the appropriate strategy and how other competitors behaved in the market.
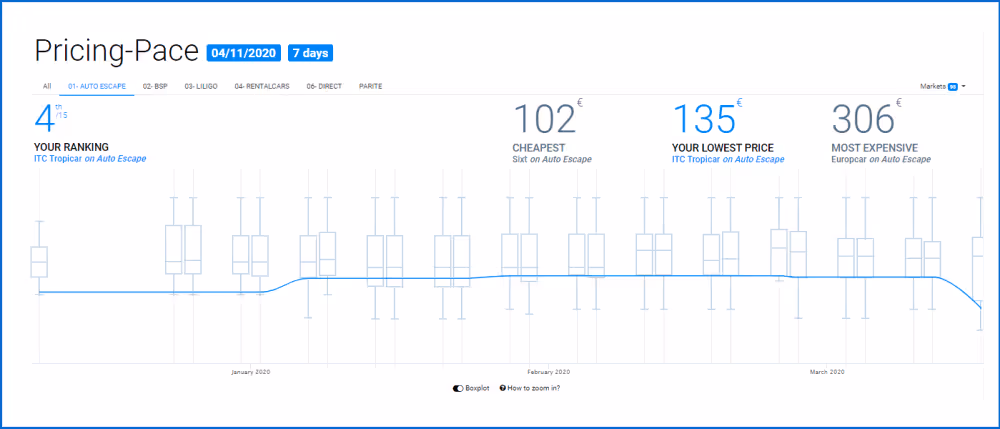
Illustration: in the above report, the data collection date is represented by the x axis and prices by the y axis. In this example, the client chose to be in the bottom quarter of the market, was this the right decision for this peak Easter period?
WeYield recommends using this alongside our piloting reports to ensure you are performing well against your targets and versus last year.
2. Maintain confidence in your pricing strategy for a given period, particularly if you win bookings with higher prices than competitors.
It is important to understand how prices moved in the past, along with the potential impact of your own bookings pace, to understand the customer demand. Remain confident in holding a high price, if your booking situation also looks promising, and don’t be tempted to drop just because your competitors are.

Illustration ⓵ For this key December date, the client held their prices high during September, ⓶ they adjusted by choosing to be below the market during October. ⓷ Finally they pushed up rates in November, maybe due to overwhelming demand and as a result, sold out 3 weeks before the departure ⓸. Potentially they could have avoided being oversold by having higher prices from October, instead of dropping below the market?
3. Monitor your competitors lower prices that could force unplanned stop sales which might enable you to maintain or raise your price position.
Identify if any of your competitors’ low pricing strategies frequently forces them to have to stop sell in advance of a pickup date, where they are possibly missing late demand and higher revenue per transaction (RPT).
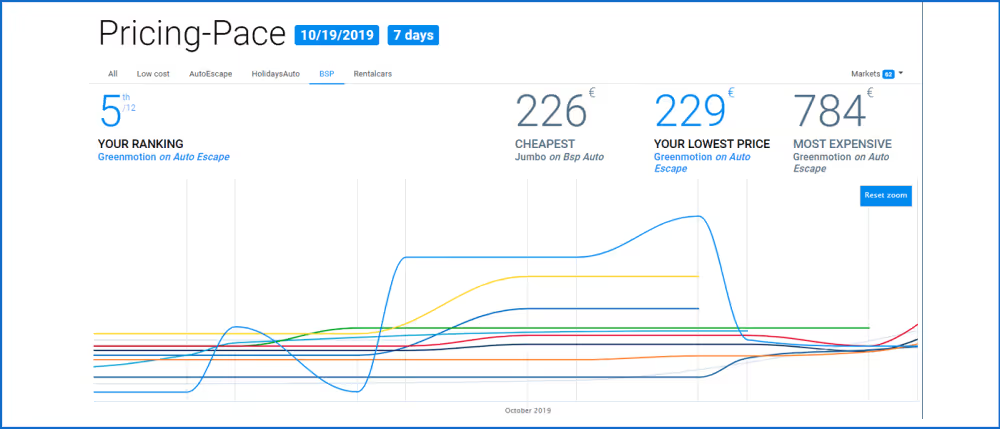
Illustration: this report tells us that there were many Stop sells in advance for multiple brands on the 19th of October last year : this indicates that brands can consider higher pricing levels this year so as not to sell out early.
4. Understand if your competitors have different strategies for different destinations.
Identify if your competitors always change prices a specified number of days in advance of pickup. Does this change by station location or by source (website their car is sold on)? Do your competitors follow your pricing or follow each other? Do they price differently by season? Are poor pricing strategies of others impacting the profitability of your market?

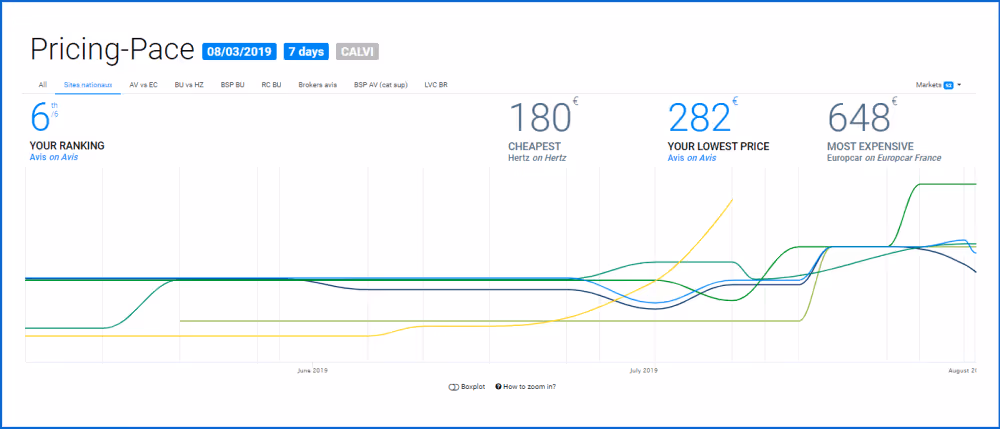
Illustration: these reports advise us that last year there were different pricing strategies in place for 2 stations on the same island.
5. Identify if your price relevant to the competition might have had an impact on your bookings performance or impacted the speed of your own bookings.
In combination with the WeYield Booking Pace report, which shows how bookings accumulated over time for a given pickup date, you have a powerful way to investigate if price competitiveness had an impact on your bookings performance.
If you are interested in learning more about the Booking Pace report or other Piloting modules, please get in touch.

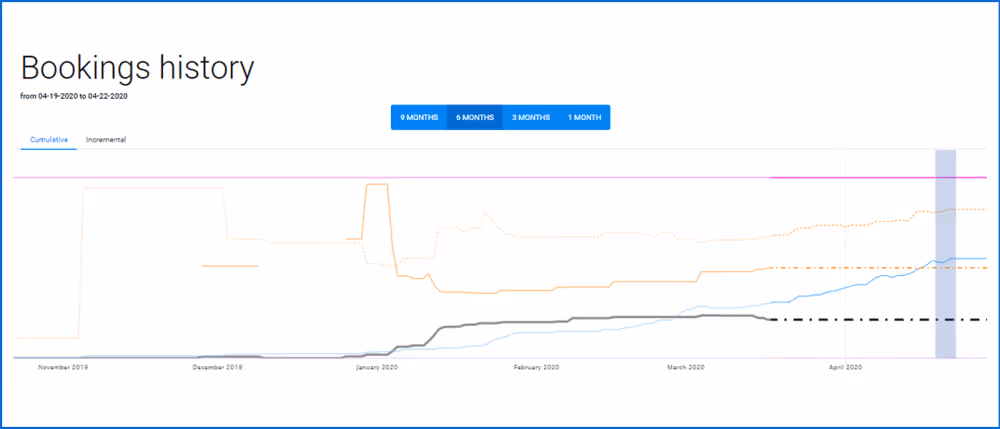
Illustration: by matching the competitor price evolution with our own bookings pace report, we can see that bookings appear to not be increasing at the same rate for this particular pickup date since the decision was taken to adjust prices to be the top of the market from February onwards.
6. Identify if competitors are pricing special events differently.
Are competitors starting low and then increasing prices as they get closer to special events? Are any of your competitors priced too low and showing signs they might have to stop sell?

Illustration: in this example, we can see high pricing in place many months in advance for an event (Ultra-trail running race) in Reunion Island last year, which again increased even more 3 weeks before the pick-up on the 19th of October.
7. Review old pricing data to identify if a competitor is pricing differently this year vs. last year.
Identify if a competitor has switched their strategy from last year or last season, how does this impact your own plans?
8. Use the boxplot view to understand the spread of prices as well as your relative position in the market at any collection time.
Boxplots indicate if prices were quite varied in the market or if prices were tightly clustered together, this could be indicative of whether different strategies are in play or if competitors are all following the leader in the market. Hopefully not the one with the lowest RPT!

9. Consider supplementing scheduled searches with rateshop planner credits to build price history for your key dates and durations.
Our clients run scheduled activity in their accounts that often differs by seasonal demands. We recommend supplementing this activity with on demand rateshops for key dates in your year to build up extra price history for your peak periods, so you can identify any competitors price movements / possible intended strategies further in advance, giving you more time to refine your own plans.
To summarize
- The new pricing pace reports helps you to identify historical price movements to justify your current pricing strategy.
- Competitor price movements might suggest the pricing strategies they use and might show different tactics in place by duration or location or even sales source.
This is just a small selection of some of the use cases we have seen since the new functionality was launched in February 2020
Please let us know if you have found other interesting use cases when using the pricing pace report, so we can share with your fellow revenue management colleagues.