

The goal is to share some key performance indicators for the months of July and August 2020 from our WeYield Apps. In this ninth edition, we compared the indicators between two reference dates (15th June versus 31st July).
These data have no statistical mean due to limited set of companies but more to step back and enlarge the perspective to other areas on the planet. Hope this helps.
Let’s believe the pick-ups are back.


August – Large increase in days indicates strong demand for this month, RPD is strong at +11% versus last year.

August – much stronger demand since Mid July, reflected in days growth (+29%) and slight increase in fleet (+2%).

August – Fleet has increased by 7%, suggesting better than expected demand, Days on rent grew +54% since Mid July review and RPD increased by 4%, and is now only 3% behind last years RPD at same time. We expect prices to continue to rise.
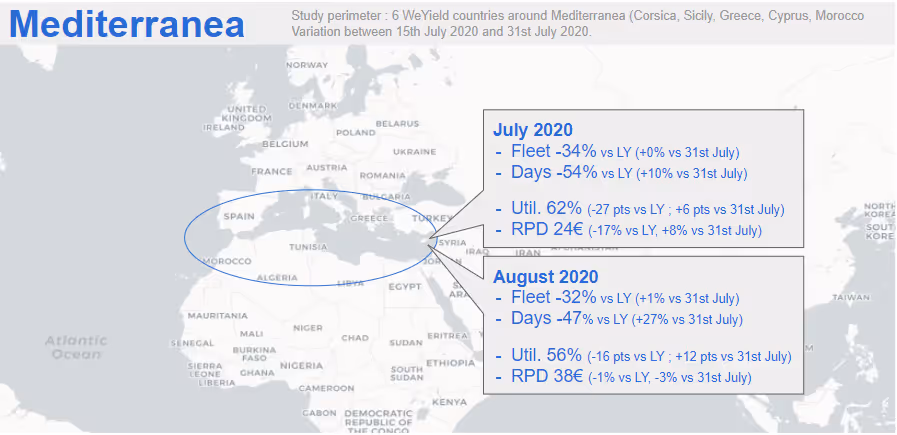
August – +1 increase in fleet reflects surge in demand (+27% in Days on rent since Mid July review). Util is already at 56% up 12 pts in past two weeks, but behind last year (72%).

August – Fleet has increased by +8% since Mid July review reflecting strong August demand. Days on rent grew by +28%, RPD up 2% Util is 61% 7 pts ahead of last year at same time.

August – Very strong days growth (+60%) and minor RPD increase (+1%) as demand is building for this month of travel. Current Util is 48%, only 2 pts behind last year at same time.