

The goal is to share some key performance indicators for the months of July and August 2020 from our WeYield Apps. In this second edition, we compared the indicators between two reference dates (15th April versus 30th March).
These data have no statistical mean due to limited set of companies but more to step back and enlarge the perspective to other areas on the planet. Hope this helps.
Take care.

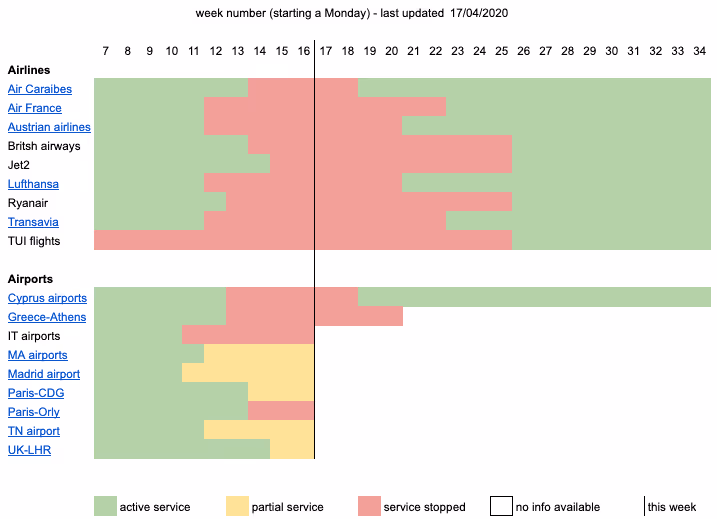
Latest lockdown info
(last update 17 april 2020)
- Austria : announcement Sunday 12th April, partial 1st lockdown lifted as of Monday 13th April, second phase as of 1st May.
- France : announcement Monday 13th April, partial 1st lockdown lifted as of Monday 11th May, second phase as of ??
- Iceland : announcement Tuesdat 14th April, partial 1st lockdown lifted as of Monday 4th May.
- Germany : announcement Wednesday 15 April, partial 1st lockdown lifted to start as of Monday 4th May
- UK: announcement Thursday 16 April, partial 1st lockdown lifted to start as of Monday 11th May
Last market trend, 3rd edition, updates from 30th March to 15th April 2020

Unfortunately we are seeing more days of cancellation compared to two weeks ago (-9%)

August is performing better : there is an increase in days by 3% compared to 30th March.

Days are increasing in July due to mid term business, explaining also the decrease in RPD. we recommend to maintain strong pricing in place for the retail business, to limit the decrease in revenues.

Days have increased over the past two weeks in July. This is a good sign, we recommend to not decrease the prices further.

Days, Utilization and Revenues have increased since 2 weeks ago for July and August due to the income of mid term business.
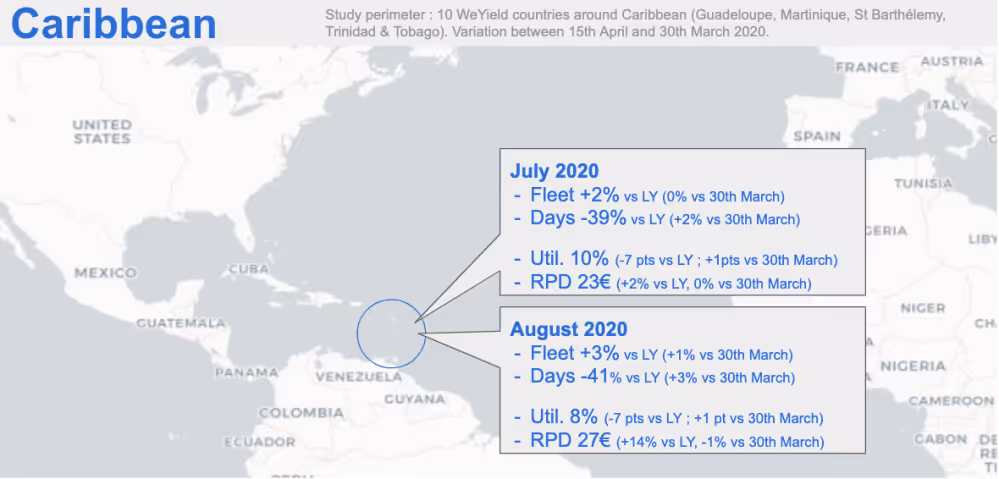
Days have increased by 2% in July and 3% in August since the past two weeks, along with a revenue increase, which are both good signs!