
.jpg)
Prediction is very difficult, especially if it’s about the futureNiels Bohr
The recent crisis of the COVID 19, has had a tremendous impact on our businesses and our daily lives, and we’re only at the beginning of this major upset. In this article we will look at the impact it has had on our prediction tools inside the Apps: forecast and estimate.
I will fast forward to the conclusion: this unprecedented and unexpected event has really rendered prediction figures completely wrong. This is of course not a surprise. But please keep on reading, because even when knowing the end of the story, there are interesting things to learn along the way.
Some reminders before moving further:
- Demand estimate computation: let us just look again at the formula for each coming day:
- TY _otb + (LY_actual – LY_otb)
- Where TY means this year, LY means last year, OTB means “on-the-book”
- Forecast computation: we have several machine learning algorithms, which all attempt to make a forecast each day, combining all the available data in the past, weighting past years activity and the current trend. We select the best one according to its accuracy at predicting past data.
It is important to note at this stage, that the estimate is a relative figure: we start from today’s OTB values for coming days, and add an estimated growth or decrease; whereas the forecast is an absolute figure: the algorithm predicts day by day a final on-rent value.
We’ve already covered the biases the estimate formula might have during the demand forecast workshop of our 2019 Academies in Paris and London, but still, client’s data analysis has shown that the estimate computation is generally quite precise when the level of activity is relatively similar to last year.
But what happens when there is a sudden change in the activity pattern ?
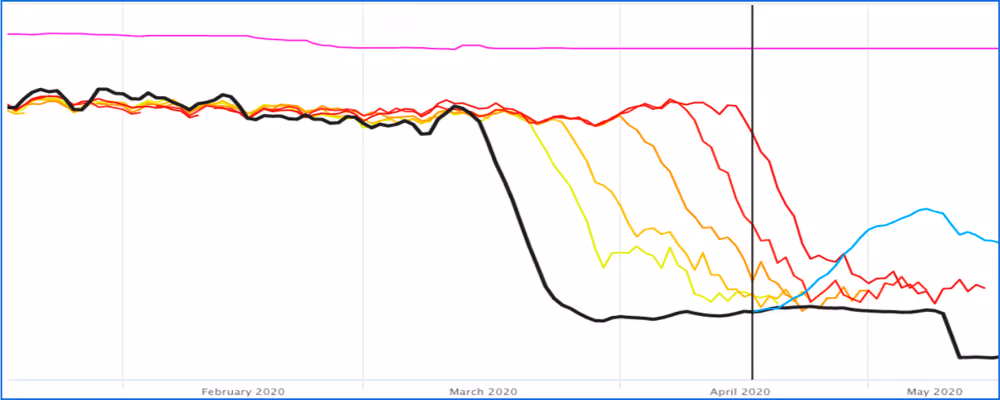
When the level of activity increases or decreases dramatically, the estimate formula adapts instantaneously to this change, because it always starts from this year’s on-the-book value. Whereas the forecast, considering primarily the activity from the last years, will have a difficult time predicting correct values, until it has catched up with the trend, and adjusted its predictions.
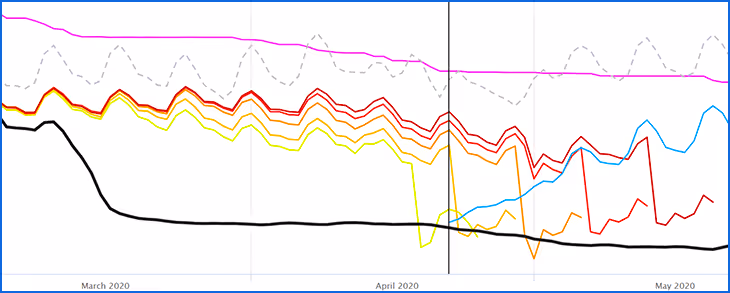
Here, our two “star” algorithms perform quite differently. The first one, XGBoost, which I thought was quite conservative, i.e. more influenced by last year’s activity levels rather than the trend, proved me wrong. The brutal dive of activity is reflected in the forecast after just 5 days. This is half a surprise though, because this algorithm is capable to predict quite accurately activity for companies with high seasonality variance and very steep scaling up or down.
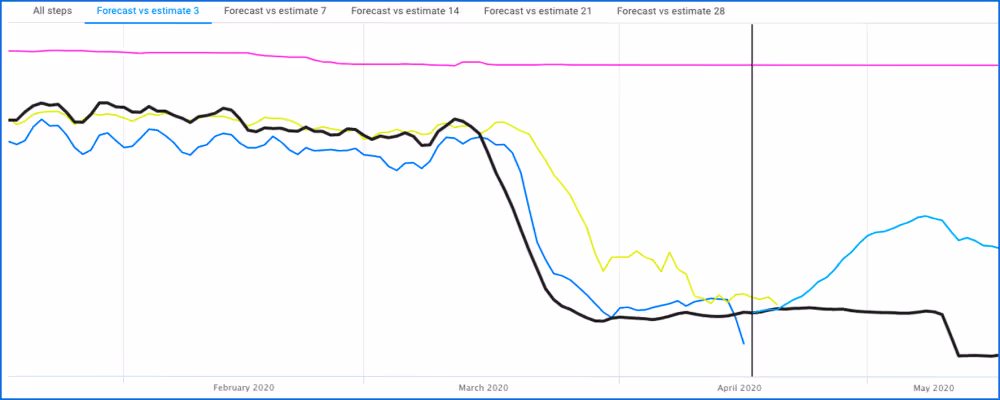
Concerning the estimate (illustration 2), we can see the 3 days ahead estimate (in blue) catching up even quicker than the 3 days ahead forecast (in yellow).
The second main machine learning algorithm that we use, Facebook’s Prophet, usually gives amazing predictions on a regular activity, with low or medium variations along the season, and bad predictions when the variations are too sudden (even seasonal ones). It is quite good to catch up with little trend changes, but here it is clearly at a loss. The algorithm slowly adapts, but not quickly enough to have a real impact on the forecasted values accuracy.
The forecast may take into account more parameters than the estimate, but when faced with an unprecedented event, the Prophet algorithm has difficulty coping with it.
How we improve the forecast in a time of crisis?
It is interesting to note first, that our initial choice of implementing several machine learning models, was a good one. Indeed, we can see that each one has strengths and weaknesses and that at least one of our algorithms catches up with the trend changes efficiently. So when put into competition with the other algorithms, it will become clear after a some time that it performs better than the others and it will be selected more often for the daily forecast. But still, there will be a delay for this selection.
The real problem is that we are faced with a real difficulty when it comes to making absolute predictions. Even if it works well most of the time, it is almost useless during a crisis.
One solution to this problem, would be to mix the adaptability of the estimate, starting from the current level of activity, with the power of machine learning being able to analyze and use more data than just basically a past evolution.
Thus, rather than forecasting absolute values of forecast, we could forecast relative values of forecast as day to day variations, and add them up starting with the last complete day of activity’s on rent. There are of course many other ways to make a relative forecast, but this was the quickest way to implement it on top of our current forecast.
The idea is simple and seems appealing, but like any prediction, it has ups and downs. And we’ll now see why.
In “normal” times, there might be small variations of activity due to a variety of events, random activity variations, and so on. So the last day’s activity value may be biased, and then starting from its level will introduce a bias inside the next 30 days of the forecast window.
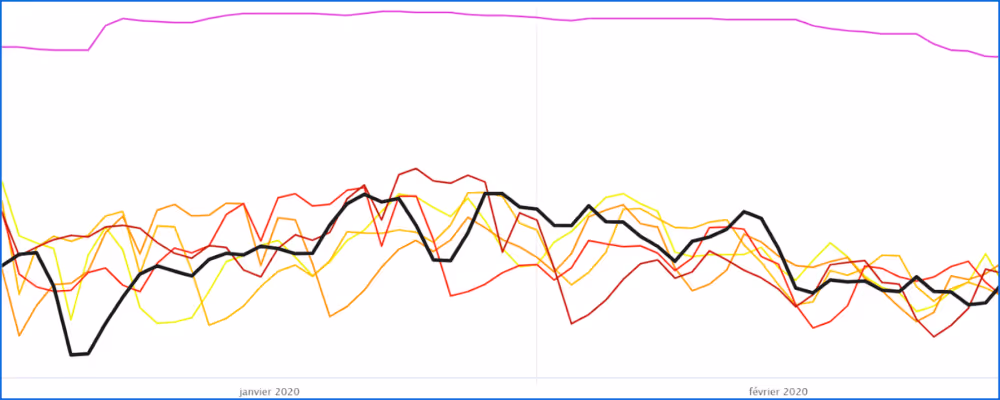
We can see it very clearly in January and February, where the activity levels were normal, and the forecast algorithms were in their best spot.

We can see clearly here, that the noise induced by the day to day variation of the starting point is affecting the mean accuracy of the forecast, but without losing too much precision though.
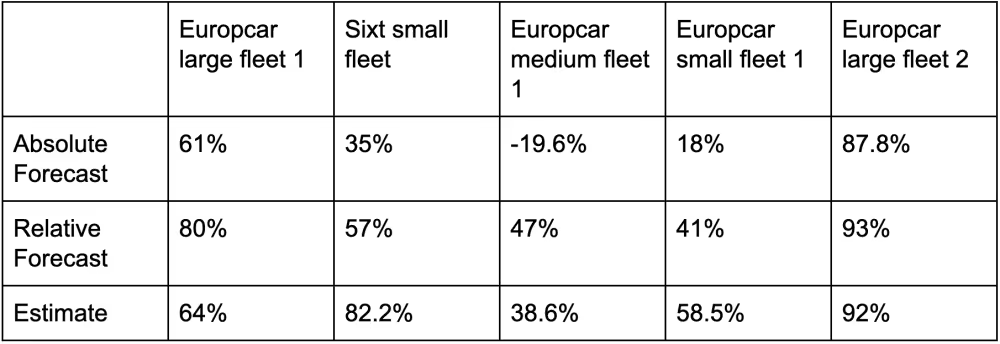
Compared to the estimate in this “good” period, we see that for a 7 days ahead time window, the Forecast performs globally better than the estimate. Apart from one company with the small fleet, and thus lower levels of activity (less data to learn from), probably because the forecast lacks historical data and volume.
This is in a way reassuring, because it means that forecasting really has an edge vs. estimate in these periods, as it ignores noise. It shows that the machine learning algorithms are really efficient in finding the right correlations in the whole activity dataset to make accurate predictions about final levels of activity.
This noise effect can be seen very clearly on the forecast statistics page, with significant day to day variations around the final on rent value. That does not mean that the forecast are not accurate, but it means it is a bit harder to follow daily.
On the other hand, during the massive drop of activity in March due to Covid 19 lockdown, the relative forecast method and the estimate have of course yielded much better results than the regular absolute forecast.
This is of course because the daily forecast has been much more adaptive to the real level of activity, by starting at the last known on rent value and then adding daily variations. The relative forecast also performs overall better than the estimate.
So we have been able, with a little change in our forecast output, to change an absolute forecast into a relative forecast, gaining a huge amount of reactivity during unprecedented events, while maintaining a good amount of accuracy during normal times.
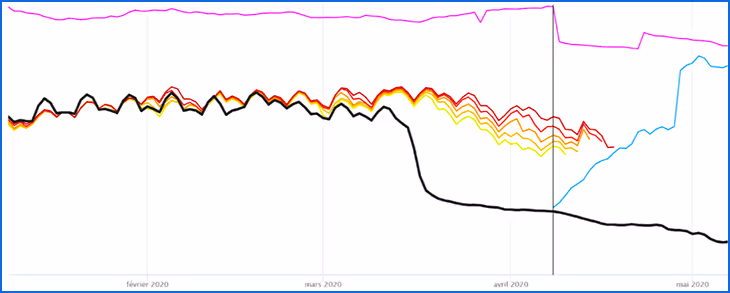
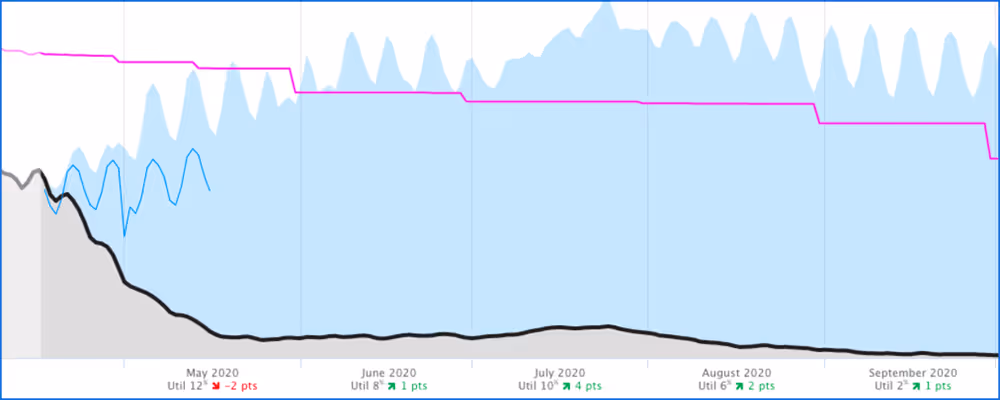
llustration 5 shows the effect, after a few days, of having tweaked the Facebook Prophet algorithm. The forecasted level of activity has instantly adjusted the day after deploying the patch, and are much closer to the OTB value, and thus probably of the final value. We can also note that the forecast is now much below the estimate.
And now, let’s focus on the estimate: how does it cope in details with the sudden change of activity?
For mid term, the estimate will still add on rent with last year’s rhythm of reservations, so it will be quite wrong:
It is important to insist though that the estimate has two major strengths for short term:
- It starts from the current OTB values for the future days, that are always up to date, reflecting the current level of activity, so it is really adaptive
- It adds the last year on rent increase between the equivalent period, which means that even for normal periods, you don’t have a big increase for the few next days, meaning a quite good short term accuracy
So here are some results for short term estimate accuracy:
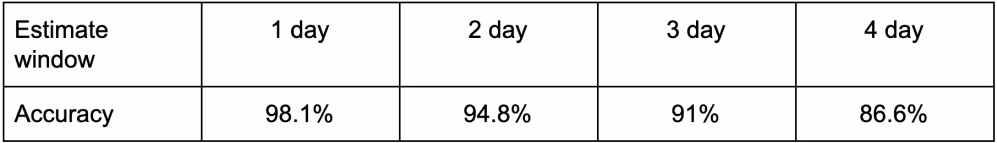
It’s interesting to have some statistical figures, but still, we see that in times like COVID 19, the on rent will majorly go down, because we will see more cancellations than new reservations. So sadly, we can mainly expect future short term demand to be lower than the OTB values.
Conclusion
As a conclusion, we can see that prediction tools, like Forecast and Estimate are designed to be adjustable, able to cope with trend variations, self-learn (for machine learning models), but are still powerless against a disruptive event the size of COVID 19.
However, it gives us an opportunity to learn from the weaknesses that we spot, and improve our tools with even more dynamic and resilient machine learning models for the forecast. It also shows the interest of combining different approaches inside the same tools : estimate, and different forecasting algorithms.
As for the estimate, we can all foresee that next years’ estimate will be useless also because of the on rent increase of 2020 that will be used in 2021, and hopefully will be totally wrong. We are thus working on a way to configure the estimate computation on a custom year rather than on the last year’s.
All in all, we know that we will never be able to make accurate forecasts or estimates taking into account the impact of an event of the magnitude of COVID 19, but we can still learn from it and make our Apps more agile.