

Purpose of the module
WeYield's target module has one ambition: to prepare the sales action plan.
In our experience, when the General Manager or analyst does this work by focusing on general objectives (overall average price for the year, number of days, total utilization rate), he or she can put aside thinking about commercial issues. At WeYield, we call this thinking the Commercial Action Plan.
As commercial negotiations with companies, brokers, tour operators, and tour operators only take place once a year, it is essential to measure the contribution of each segment before setting a global target to increase the margin. WeYield's "target" module allows you to simulate different scenarios by playing on several variables to measure their impact:
- If I decrease my fleet and limit the share of Brokers (low contribution), how much will I increase my revenue per vehicle?
- If I increase the share of Brokers at the expense of high-contribution direct customers, what will be the impact on total volume and my average annual price? Does this require adjusting (increasing or decreasing) my available capacity?
- If I increase my price for the corporate segment by €2 in low season but decrease it by €1 in high season, how will this impact my annual revenue?
How does it work
At WeYield, we already have the business data that is in the history of the WeYield apps. In 3 clicks, the analyst will
Choose
- a target year on which he wants to set his objectives to work
- select the desired car type
- choose the reference year to be used for comparison
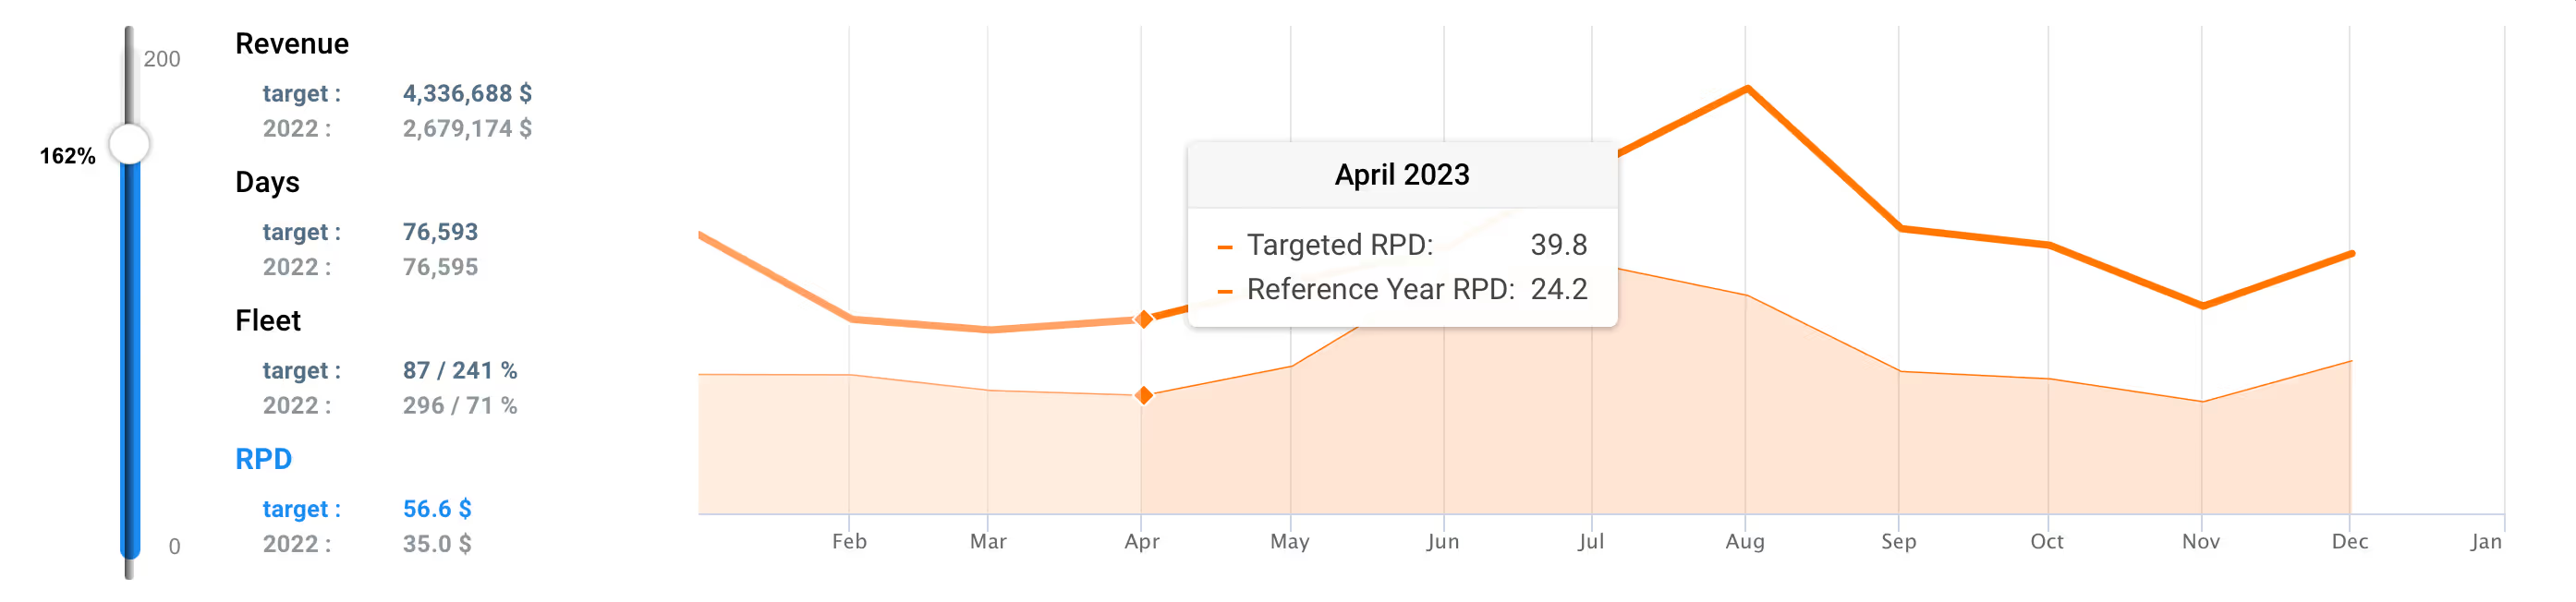
Define the dimension on which he is going to work on his major growth axes for the coming year.
- the capacity (the fleet per car group ex Mini, Eco according to the configuration previously made for its piloting)
- the geography of its territory (regions and zones)
- the segments (commercial sources).
Give a name to your simulation.
Once the first version of the target has been achieved, it is possible to generate another one to simulate another more ambitious or more conservative scenario (minimum, average, maximum hypothesis for example).
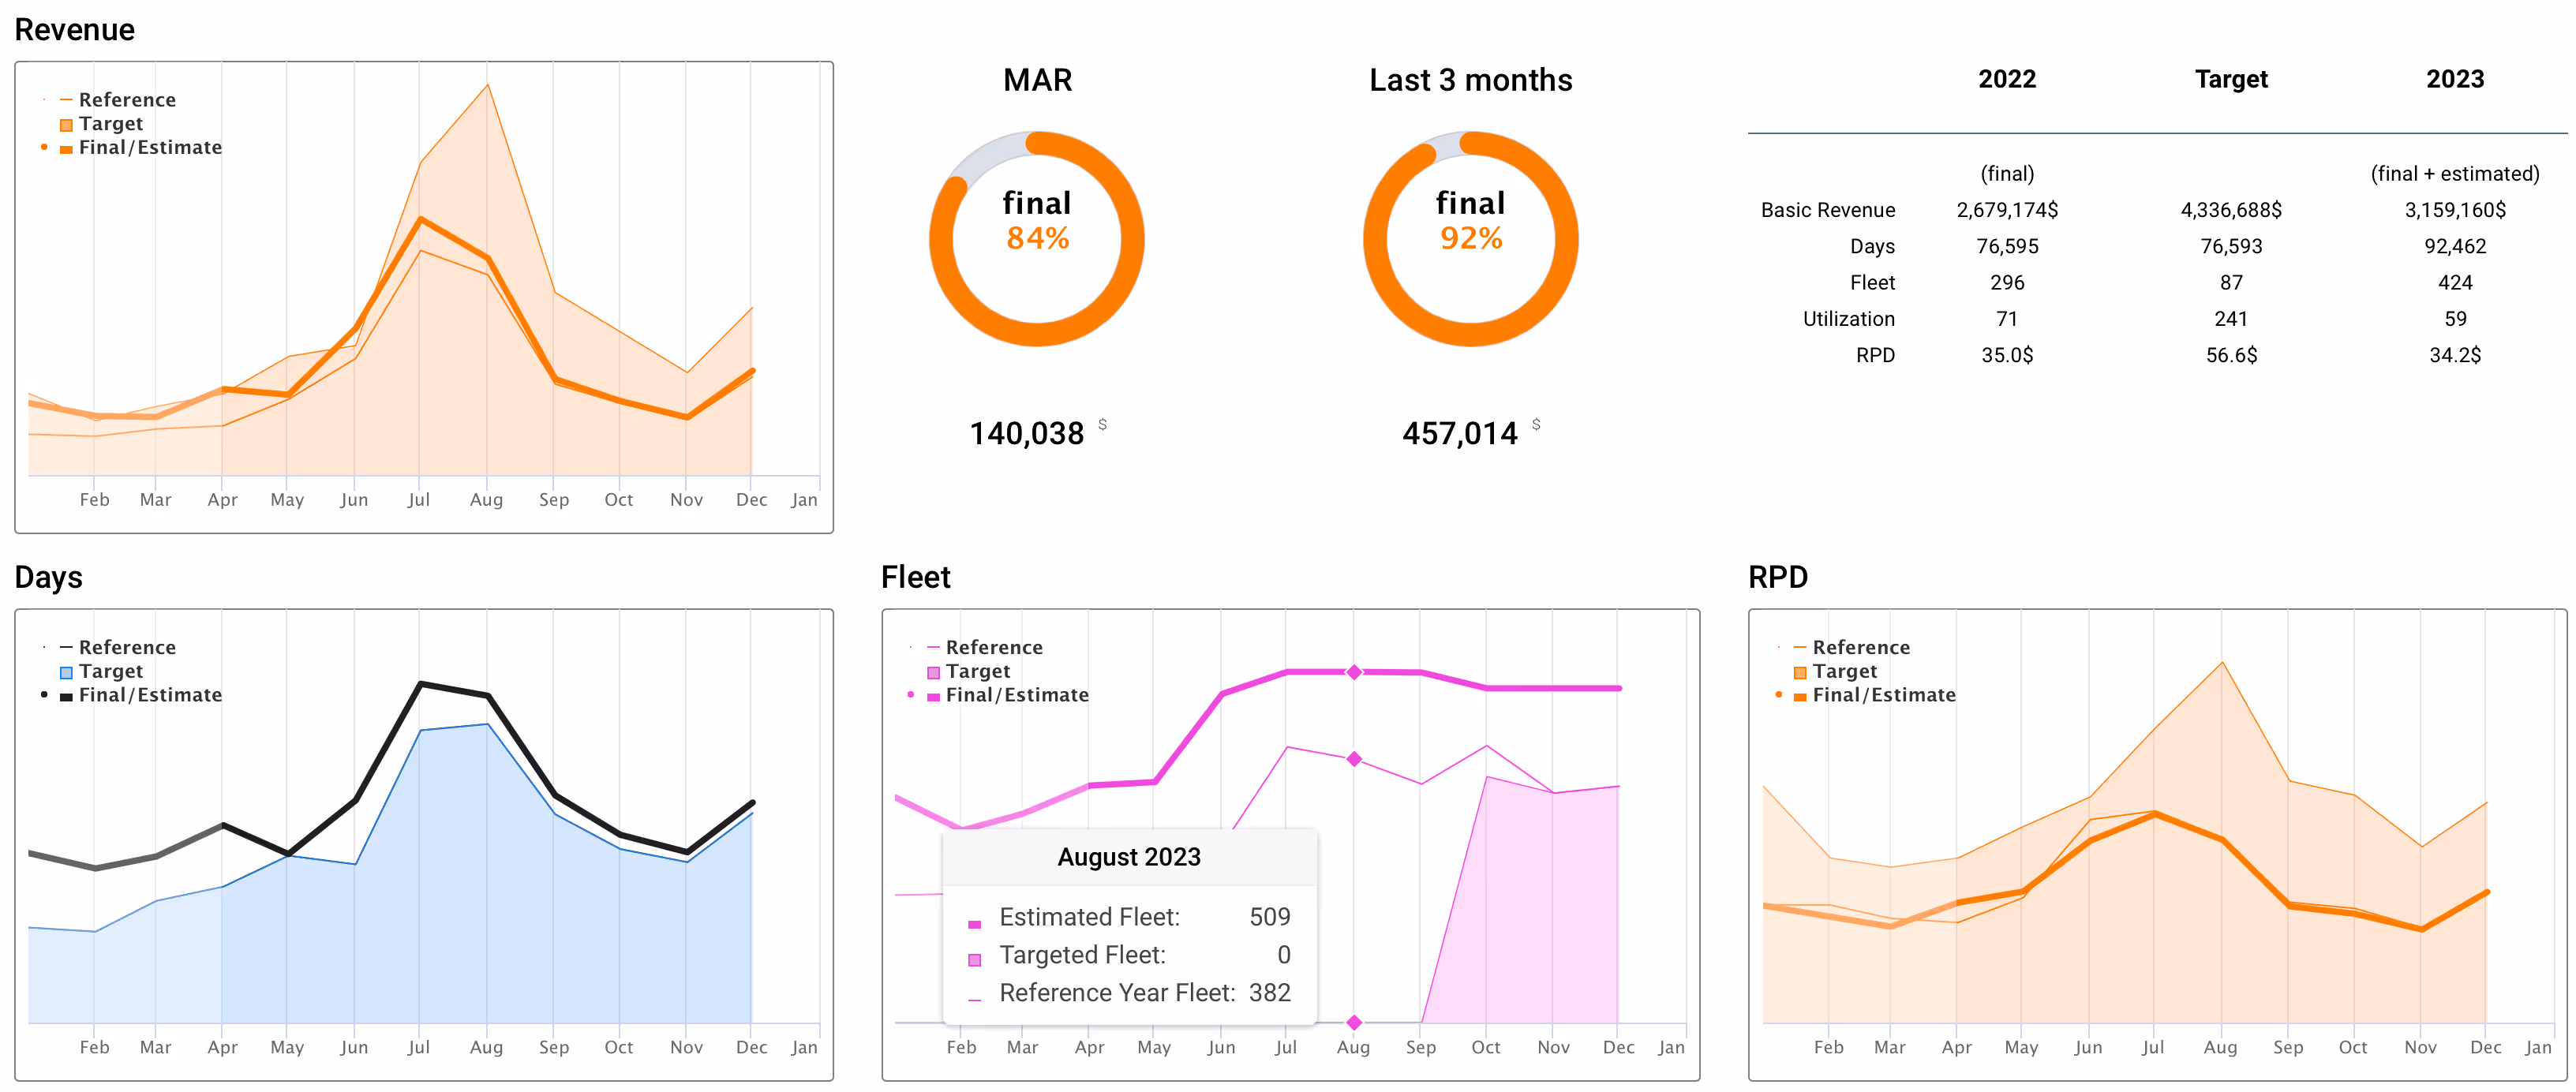
After validation of a scenario, it will display the real data in order to measure the variance month by month.
Product advantage
In real life, an analyst often needs to work on several simulations: a reasonable scenario, a pessimistic version at the very least, and a very optimistic aggressive version.
The user doesn’t need to start from a reference year but from their previous scenario and rework another more conservative or aggressive version. This feature is very useful in the event of very changing economic situations that would have a strong impact on the business and would require a revision of the sales action plan during the year.
This elaboration of different scenarios also allows the analyst to present different plans and the commercial actions that go with them to management. This approach is intended to initiate a strategic discussion on the means to be implemented to achieve the objectives.
The financial planner can use this basis to determine their budget by adding costs. The company can then be fully aligned between its strategic vision, how to implement it and the related costs.
All that remains is for the organization to choose a scenario that serves as a basis for the coming year. All the actual data of the year are related to this business target and the reading of the dashboard allows us to compare the actual performance with the target vision.
Of course, all the data can be exported to Excel in order to be integrated into different internal tools of the company.
Tasks it helps me complete?
The target tool allows you to have a precise vision (via the notes) of what the management wants to achieve. In addition, this process of building a precise target month by month and the selected dimensions allows to challenge the global vision and to verify what is possible to achieve with regard to the constraints.
Prerequisites
- There is no need for costs
Because it does not have cost data, this tool does not function as a financial budget. The vast majority of operators produce a forecasted budget that includes both sales and costs. This work is time consuming as it requires manual extraction of data from available systems, consolidation and analysis. Often this is done using Excel.
- Must have an active account in WeYield apps
- Must have at least one year of history, fleet and volume data. Segmentation must be effective, i.e., allow for a proportional breakdown of activity. The fleet can also be configured correctly with a breakdown by car groups or car types.
- The choice of a reference year depends on the historical data present in the database. This data does not depend on WeYield but on the extraction possibilities that the software used as an operational system can provide or has provided.
Free and Paid Service
The "Target" module is included in the monthly subscription and its activation does not require any additional cost. However, it is intended for advanced users with at least one year of experience in optimization. Its activation is therefore subject to validation with your CSM or Customer Success Manager.
Tips, Tricks and Best Practice
- Don't have too many customer account segmentation to facilitate the work on dimensions. Our CSM-Customer Success Managers recommend having between 6 and 8. Beyond that, the activity is analyzed in portions that are sometimes too small, which does not facilitate the understanding and management of the activity
- For the geography dimensions (zone and regions), it is also suggested to have a homogeneous distribution throughout the territory considered. Otherwise, the risk is to have to project a future activity on a too small part of the territory without real impact on the global activity. Our CSM-Customer Success Managers recommend having between 2 and 3 zones and 6 to 8 regions maximum.
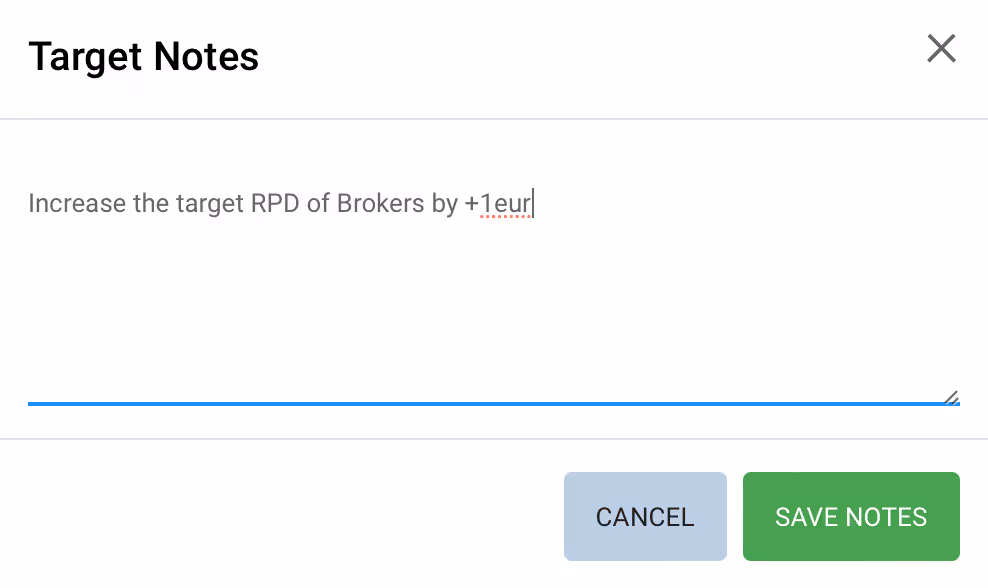
- Use the "note" button at the top right of the screens to note all the elements of reflection that lead to the choice of a particular scenario. This allows you to better illustrate the business orientations chosen and explain them to management and/or teams.
Frequently Asked Questions
I have zero data for some months in the history?
WeYield uses historical data from the operational system during the initial integration. Without a fleet and past activity, it is not possible to retain all the base years.
How come I have fleet and usage data when I build my target by segments?
We decided to assign vehicles to each segment based on the percentage share of each in the overall volume. So if a segment represents 50% of your volume of days, it will be assigned 50% of your overall fleet. The utilization rate is then calculated with the two previous indicators (days/fleet). You can thus more easily simulate the importance and impact of your decisions for each of your segments.